Sign In Start Free Trial
Account

Add to playlist

Create a Playlist

Modal Close icon
You need to login to use this feature.
  • Book Overview & Buying Python High Performance, Second Edition
  • Table Of Contents Toc
Python High Performance, Second Edition

Python High Performance, Second Edition - Second Edition

By : Dr. Gabriele Lanaro
4 (2)
close
close
Python High Performance, Second Edition

Python High Performance, Second Edition

4 (2)
By: Dr. Gabriele Lanaro

Overview of this book

Python is a versatile language that has found applications in many industries. The clean syntax, rich standard library, and vast selection of third-party libraries make Python a wildly popular language. Python High Performance is a practical guide that shows how to leverage the power of both native and third-party Python libraries to build robust applications. The book explains how to use various profilers to find performance bottlenecks and apply the correct algorithm to fix them. The reader will learn how to effectively use NumPy and Cython to speed up numerical code. The book explains concepts of concurrent programming and how to implement robust and responsive applications using Reactive programming. Readers will learn how to write code for parallel architectures using Tensorflow and Theano, and use a cluster of computers for large-scale computations using technologies such as Dask and PySpark. By the end of the book, readers will have learned to achieve performance and scale from their Python applications.
Table of Contents (10 chapters)
close
close

Profile line by line with line_profiler

Now that we know which function we have to optimize, we can use the line_profiler module that provides information on how time is spent in a line-by-line fashion. This is very useful in situations where it's difficult to determine which statements are costly. The line_profiler module is a third-party module that is available on the Python Package Index and can be installed by following the instructions at https://github.com/rkern/line_profiler.

In order to use line_profiler, we need to apply a @profile decorator to the functions we intend to monitor. Note that you don't have to import the profile function from another module as it gets injected in the global namespace when running the kernprof.py profiling script. To produce profiling output for our program, we need to add the @profile decorator to the evolve function:

    @profile 
def evolve(self, dt):
# code

The kernprof.py script will produce an output file and will print the result of the profiling on the standard output. We should run the script with two options:

  • -l to use the line_profiler function
  • -v to immediately print the results on screen

The usage of kernprof.py is illustrated in the following line of code:

$ kernprof.py -l -v simul.py

It is also possible to run the profiler in an IPython shell for interactive editing. You should first load the line_profiler extension that will provide the lprun magic command. Using that command, you can avoid adding the @profile decorator:

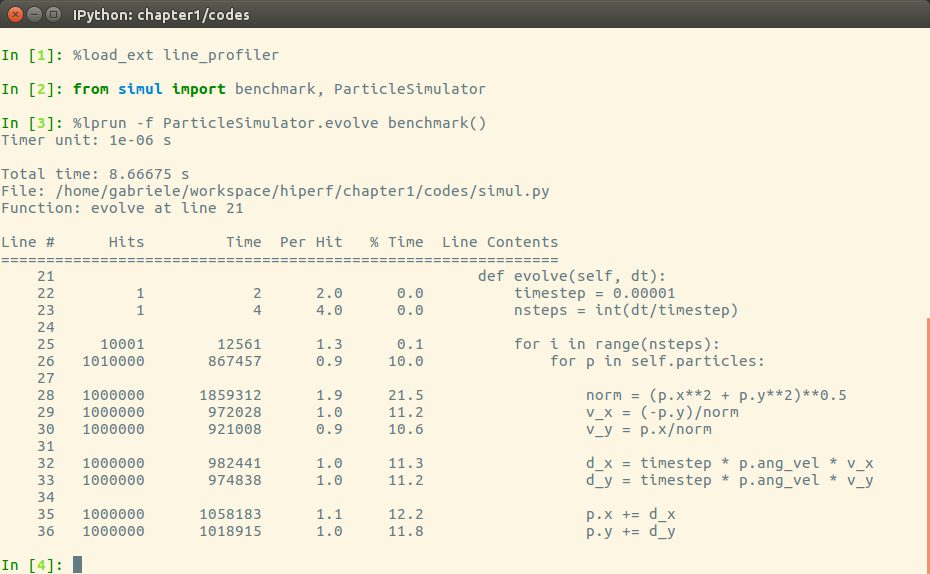
The output is quite intuitive and is divided into six columns:

  • Line #: The number of the line that was run
  • Hits: The number of times that line was run
  • Time: The execution time of the line in microseconds (Time)
  • Per Hit: Time/hits
  • % Time: Fraction of the total time spent executing that line
  • Line Contents: The content of the line

By looking at the percentage column, we can get a pretty good idea of where the time is spent. In this case, there are a few statements in the for loop body with a cost of around 10-20 percent each.

CONTINUE READING
83
Tech Concepts
36
Programming languages
73
Tech Tools
Icon Unlimited access to the largest independent learning library in tech of over 8,000 expert-authored tech books and videos.
Icon Innovative learning tools, including AI book assistants, code context explainers, and text-to-speech.
Icon 50+ new titles added per month and exclusive early access to books as they are being written.
Python High Performance, Second Edition
notes
bookmark Notes and Bookmarks search Search in title playlist Add to playlist download Download options font-size Font size

Change the font size

margin-width Margin width

Change margin width

day-mode Day/Sepia/Night Modes

Change background colour

Close icon Search
Country selected

Close icon Your notes and bookmarks

Confirmation

Modal Close icon
claim successful

Buy this book with your credits?

Modal Close icon
Are you sure you want to buy this book with one of your credits?
Close
YES, BUY

Submit Your Feedback

Modal Close icon
Modal Close icon
Modal Close icon