

Watchpoint is a very useful tool that is used to track access and/or modification of the variables. The Watchpoint is a type of breakpoint that stops whenever a variable is either accessed, modified, or both.
Please make sure that you don't have any breakpoints checked in the Breakpoints view list and the debugger is terminated.
Go to the Outline view and find the
numbervariable.Right-click on
numberand select Toggle Watchpoint. See the following screenshot: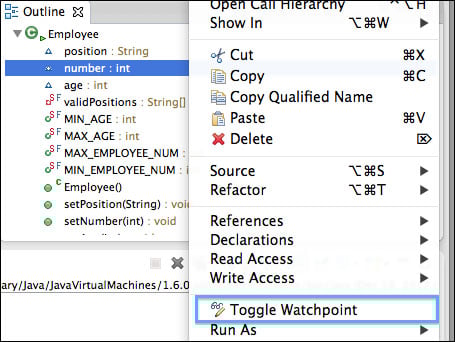
If you go to line 9, you will see that there is a
 Watchpoint icon instead of a breakpoint. This means that the current variable is being watched. Also, if you want to unset Watchpoint, just double-click on the icon. If you want to set it back, double-click again.
Run the debugger.
The first time when Watchpoint is triggered, the application stops at line 47; that is because
the main()method at line 110 called thesetNumber()method that assigned a number to the value set by the user.Click on the Resume icon.
This time the application stops at line 90; that is because the
toString()method requested access to the number variable. Note thatnumberwas modified the previous time, but this timenumberwas accessed without modification.Terminate the debugger.
Now let's assume that we are not interested in watching the access of the variable, we just want to know where it is modified.
Go to line 9, right-click on the
icon, and select Breakpoint Properties….
Uncheck Access and click on Ok.
Now your breakpoint icon looks like this:
 , which means that Watchpoint will be triggered only when a variable is modified.
Run the debugger.
Once again the application stopped at line 47 because we are modifying the variable.
Click on the Resume icon.
Now we can see the difference between this execution and the previous one. This time without stopping on line 90, the application just finished execution and terminated. This is because we are not tracking access of the variable, just its modification. The Watchpoint is a very useful tool if you want to track how your variable changes and when it gets accessed, but sometimes you want to simply run the application and just see the output in the console. For this purpose, you should use a conditional breakpoint and print its output to the user or simply use a breakpoint type called Printpoint.