
On the Home page Dynamics GP provides a default set of metrics via charts and graphs designed to provide better visualization of data based on a user's role. Individual users can include or exclude various charts from their Home page and select a default chart. In this recipe, we'll look at ways to tailor the Home page metrics for each user.
Home page metrics provide charts for additional analysis. Let's see how to put these to use by completing the following steps:
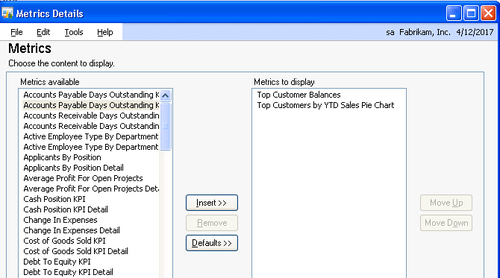
On the Home page in the Metrics section move the mouse over the title Metrics to expose additional options on the right. Click on the pencil icon that now appears on the title bar to the right.
The left-hand side shows all of the metrics available to a particular user. Selecting a metric on the left and clicking on Insert moves that metric to the right and makes it available on the user's Home page. Selecting a chart on the right and clicking on Remove eliminates that chart from the Home page:
The Metric functionality was significantly expanded in version 2010. In Dynamics GP 2010, users can add multiple metrics to their Home page. Additionally, users can create their own metrics using SQL Server Reporting Services (SSRS) and apply those metrics to their Home page. The creation of new metrics is beyond the scope of this book. However, more information on this is available via the Dynamics GP manuals.
Dynamics GP 2010 provides an option to view multiple metrics on the Home screen, open metrics in a browser window, and drill back for more information.
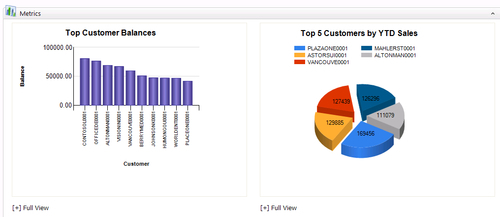
Inserting multiple metrics in the Metrics to display box will place all of those metrics on the Home page:
The option to display all of the selected metrics is controlled by the Customize this Page selection on the Home page. Once opened, the Show All checkbox under the Metrics selection of the Customize Home Page window controls how many metrics are shown on the Home page. If the Show All checkbox is selected, all of the metrics will appear. If it is not selected, one metric will show on the Home page with an option to scroll through all of the available metrics:

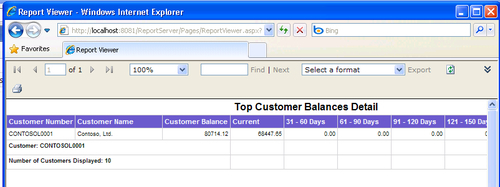
Clicking on the Full View option below a metric opens the SSRS report behind that metric in a web browser. Selecting individual items in the metric drills back to reports with more information. For example, clicking on Full View below the Top Customer Balances metric and then clicking on the CONTOSOL0001 column drills down into that customer's balance detail: