

There could be various steps while performing analytics on Big Data. Generally, there are three stages as depicted in the following diagram:
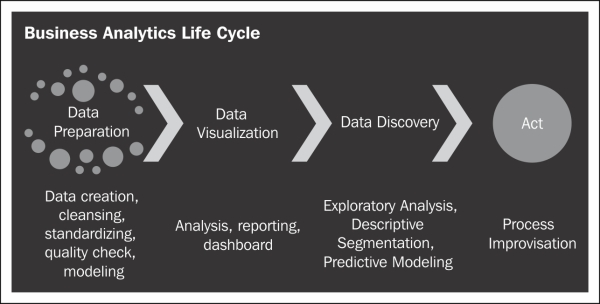
The following list gives a brief description of the three stages depicted in the preceding diagram:
Data Preparation: This stage involves activities from data creation (ETL) to bringing data on to a common platform. In this stage, you will check the quality of the data, cleanse and condition it, and remove unwanted noise. The structure of the data will dictate which tools and analytic techniques can be used. For example, if it contains textual data, sentiment analysis should be used, while if it contains structured financial data, perhaps regression via R analytics platform is the right method. A few more analytical techniques are MapReduce, Natural language processing (NLP), clustering (k-means clustering), and graph theory (social network analysis).
Data Visualization: This is the next stage after preparation of data...