
Building machine learning applications, while similar in many respects to the standard engineering paradigm, differs in one crucial way: the need to work with data as a raw material. The success of a data project will, in large part, depend on the quality of the data that you acquired as well as how it's handled. And because working with data falls into the domain of data science, it is helpful to understand the data science workflow:
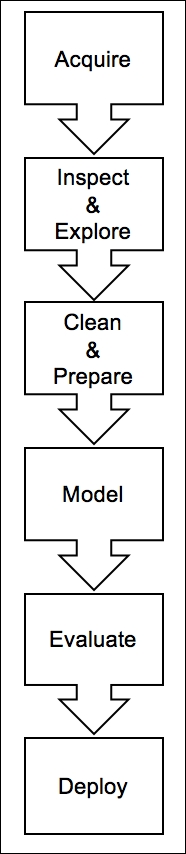
The process proceeds through these six steps in the following order: acquisition, inspection and exploration, cleaning and preparation, modeling, evaluation, and finally deployment. There is often the need to circle back to prior steps, such as when inspecting and preparing the data or when evaluating and modeling, but the process at a high level can be described as shown in the preceding diagram.
Let's now discuss each step in detail.
Data for machine learning applications can come from any number of sources; it may be e-mailed as a CSV file, it may come from pulling down server logs, or it may require building a custom web scraper. The data may also come in any number of formats. In most cases, it will be text-based data, but as we'll see, machine learning applications may just as easily be built utilizing images or even video files. Regardless of the format, once the data is secured, it is crucial to understand what's in the data—as well as what isn't.
Once the data has been acquired, the next step is to inspect and explore it. At this stage, the primary goal is to sanity-check the data, and the best way to accomplish this is to look for things that are either impossible or highly unlikely. As an example, if the data has a unique identifier, check to see that there is indeed only one; if the data is price-based, check whether it is always positive; and whatever the data type, check the most extreme cases. Do they make sense? A good practice is to run some simple statistical tests on the data and visualize it. Additionally, it is likely that some data is missing or incomplete. It is critical to take note of this during this stage as it will need to be addressed it later during the cleaning and preparation stage. Models are only as good as the data that goes into them, so it is crucial to get this step right.
When all the data is in order, the next step is to place it in a format that is amenable to modeling. This stage encompasses a number of processes such as filtering, aggregating, imputing, and transforming. The type of actions that are necessary will be highly dependent on the type of data as well as the type of library and algorithm utilized. For example, with natural-language-based text, the transformations required will be very different from those required for time series data. We'll see a number of examples of these types of transformations throughout the book.
Once the data preparation is complete, the next phase is modeling. In this phase, an appropriate algorithm is selected and a model is trained on the data. There are a number of best practices to adhere to during this stage, and we will discuss them in detail, but the basic steps involve splitting the data into training, testing, and validation sets. This splitting up of the data may seem illogical—especially when more data typically yields better models—but as we'll see, doing this allows us to get better feedback on how the model will perform in the real world, and prevents us from the cardinal sin of modeling: overfitting.
Once the model is built and making predictions, the next step is to understand how well the model does that. This is the question that evaluation seeks to answer. There are a number of ways to measure the performance of a model, and again it is largely dependent on the type of data and the model used, but on the whole, we are seeking to answer the question of how close are the model's predictions to the actual value. There are arrays of confusing-sounding terms such as root mean-square error, Euclidean distance, and F1 score, but in the end, they are all just a measure of distance between the actual value and the estimated prediction.