Book Image

Mastering Microsoft Power BI

By : Brett Powell
5 (1)
Book Image

Mastering Microsoft Power BI

5 (1)
By: Brett Powell

Overview of this book

This book is intended for business intelligence professionals responsible for the design and development of Power BI content as well as managers, architects and administrators who oversee Power BI projects and deployments. The chapters flow from the planning of a Power BI project through the development and distribution of content to the administration of Power BI for an organization. BI developers will learn how to create sustainable and impactful Power BI datasets, reports, and dashboards. This includes connecting to data sources, shaping and enhancing source data, and developing an analytical data model. Additionally, top report and dashboard design practices are described using features such as Bookmarks and the Power KPI visual. BI managers will learn how Power BI’s tools work together such as with the On-premises data gateway and how content can be staged and securely distributed via Apps. Additionally, both the Power BI Report Server and Power BI Premium are reviewed. By the end of this book, you will be confident in creating effective charts, tables, reports or dashboards for any kind of data using the tools and techniques in Microsoft Power BI.
Table of Contents (15 chapters)

Data warehouse bus matrix

The fundamentals of the dataset should be designed so that it can support future BI and analytics projects and other business teams requiring access to the same data. The dataset will be tasked with delivering both accurate and consistent results across teams and use cases as well as providing a familiar and intuitive interface for analysis.

To promote reusability and project communication, a data warehouse bus matrix of business processes and shared dimensions is recommended:

Data warehouse bus matrix

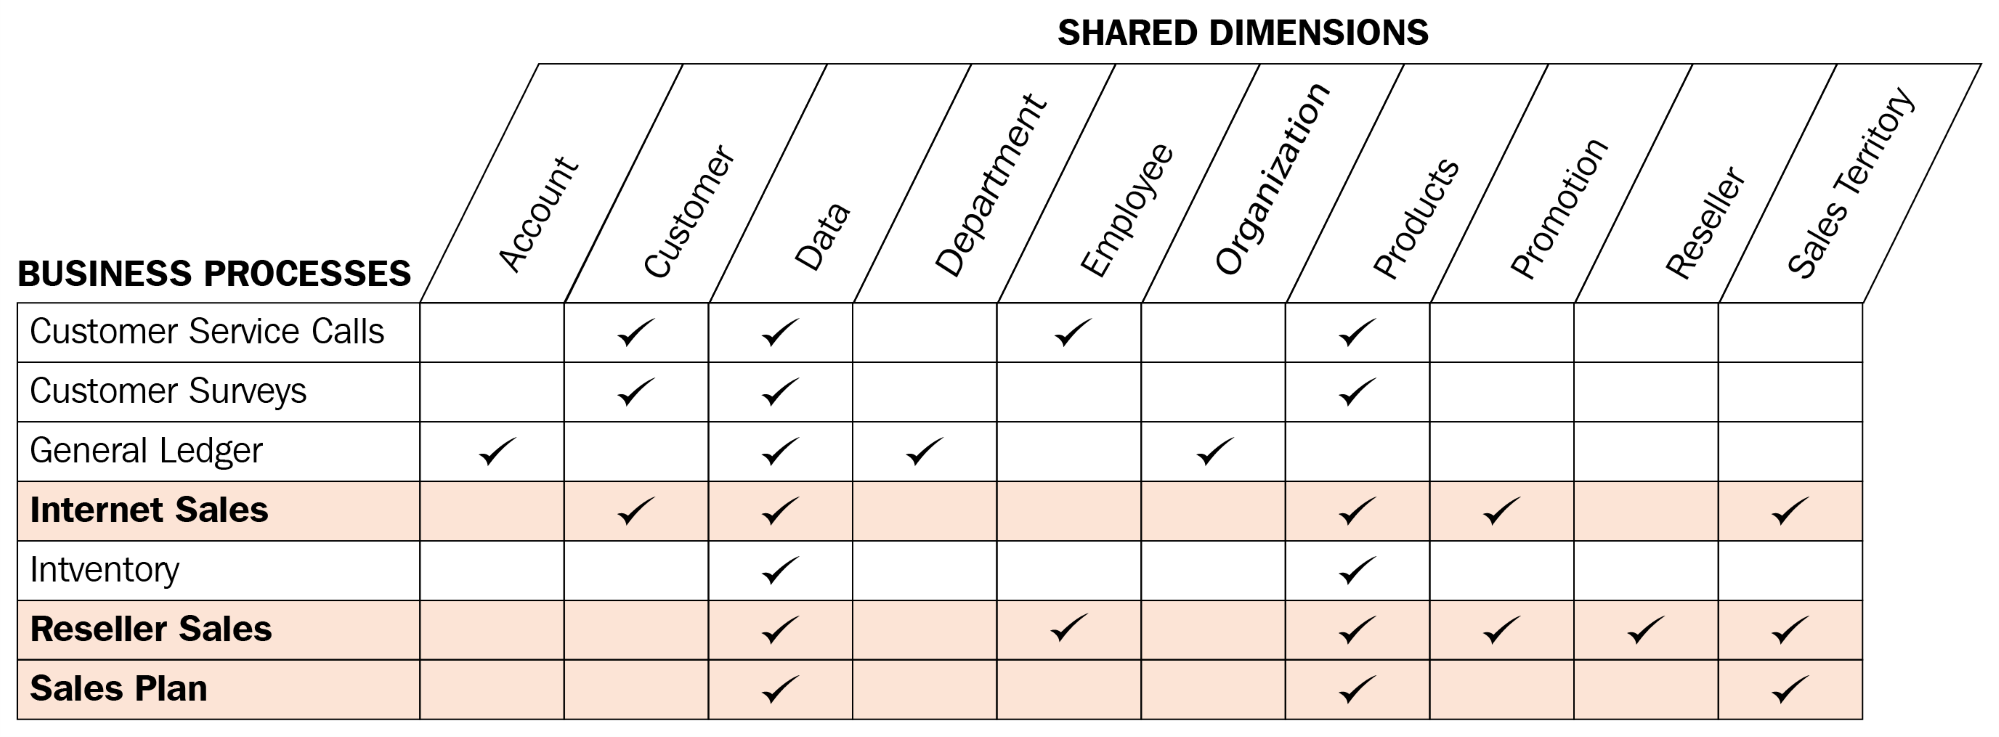
Each row reflects an important and recurring business process, such as the monthly close of the general ledger, and each column represents a business entity, which may relate to one or several of the business processes. The shaded rows (Internet Sales, Reseller Sales, and Sales Plan) identify the business processes that will be implemented as their own star schemas for this project. The business matrix can be developed in collaboration with business stakeholders, such as the corporate finance manager, as well as source system and business intelligence or data warehouse SMEs.

The data warehouse bus matrix is a staple of the Ralph Kimball data warehouse architecture, which provides an incremental and integrated approach to data warehouse design. This architecture, as per The Data Warehouse Toolkit (Third Edition) by Ralph Kimball, allows for scalable data models, as multiple business teams or functions often require access to the same business process data and dimensions.

Additional business processes, such as maintaining product inventory levels, could potentially be added to the same Power BI dataset in a future project. Importantly, these future additions could leverage existing dimension tables, such as a Product table, including its source query, column metadata, and any defined hierarchies.

Each Power BI report is tied to a single dataset. Given this 1:1 relationship and the analytical value of integrated reports across multiple business processes, such as Inventory and Internet Sales, it's important to design datasets that can scale to support multiple star schemas. Consolidating business processes into one or a few datasets also makes solutions more manageable and a better use of source system resources, as common tables (for example, Product, Customer) are only refreshed once.