

As any experienced Qlik developer will tell you, the Data model viewer is a key component you will undoubtedly use on your Qlik journey. Qlik Sense has brought with it some nice new features. We will also delve into the different insights that can be gleaned from the Data model viewer:
For this recipe, we will make use of the Data model viewer.qvf application. This file is available for download on the Packt Publishing website.
- Open the
Data model viewer.qvfapplication that has been downloaded from the resource library. - Click on
Data model viewerin the Navigation drop-down on the toolbar.
In this section, we will see how the different types of data are viewed.
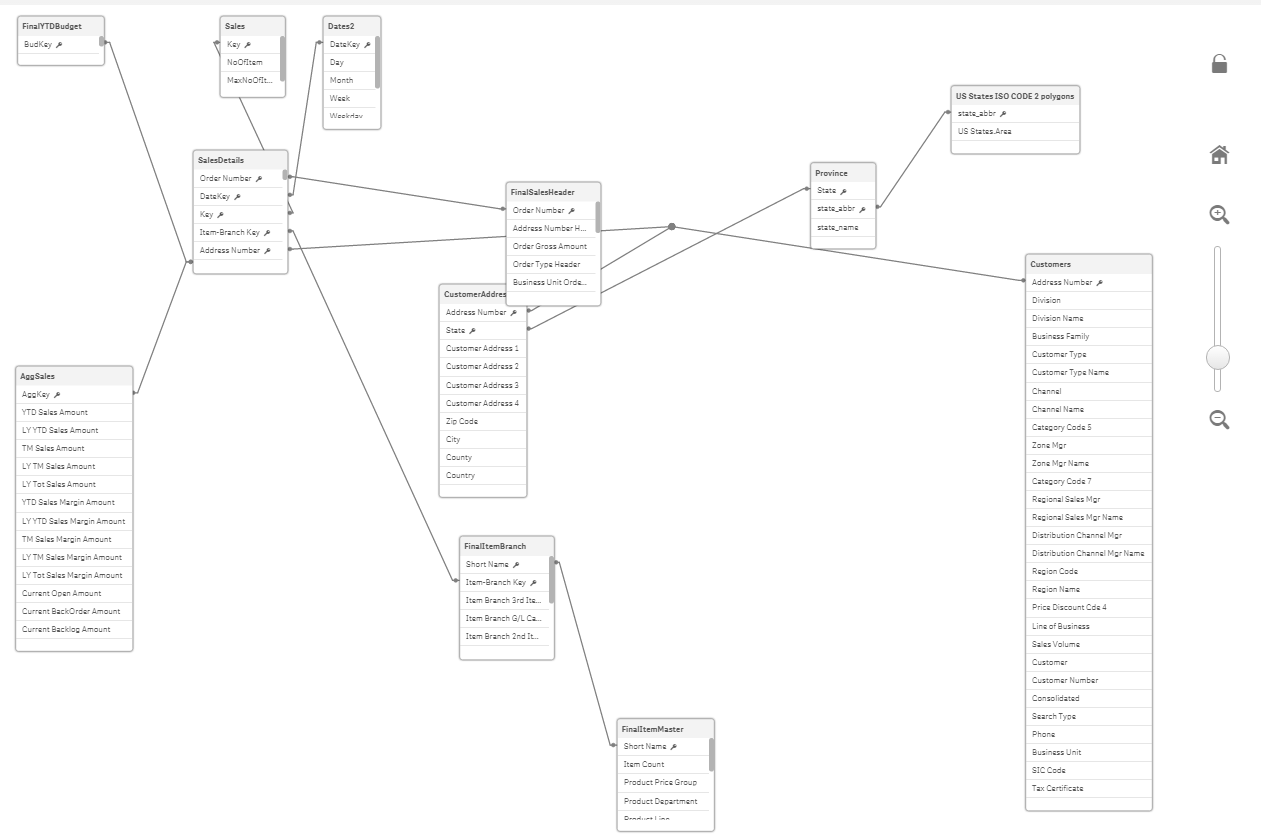
The data model consists of a number of tables joined by the key fields. The following screenshot contains functions that can be used to manipulate the layout of the data model:
The details of the available keys (from right to left) are given as follows:
- Collapse all: This reduces the tables to just their headers, thus hiding all the fields
- Show linked fields: Expands the tables enough to only display the key fields in each
- Expand all: Displays all the fields for each table
- Internal table viewer: Shows the internal representation of the data model
- Layout: Provides options to auto-align the table grid or space out across the screen
- Show preview: Toggles the data preview screen to either on or off
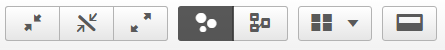
Clicking on a table will highlight its associated tables in orange. The customer's table is selected in the following screenshot and the shared key here is Address Number:
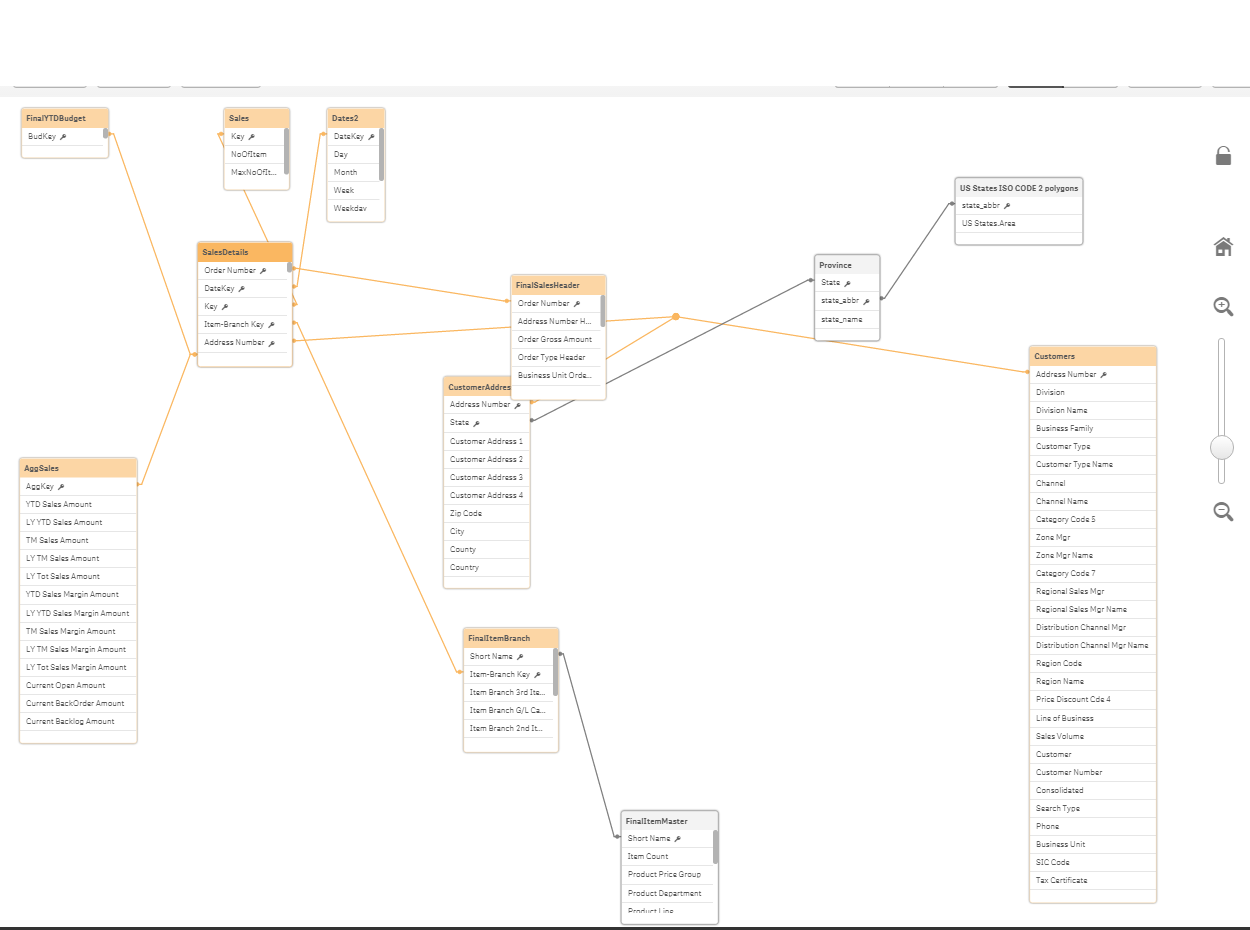
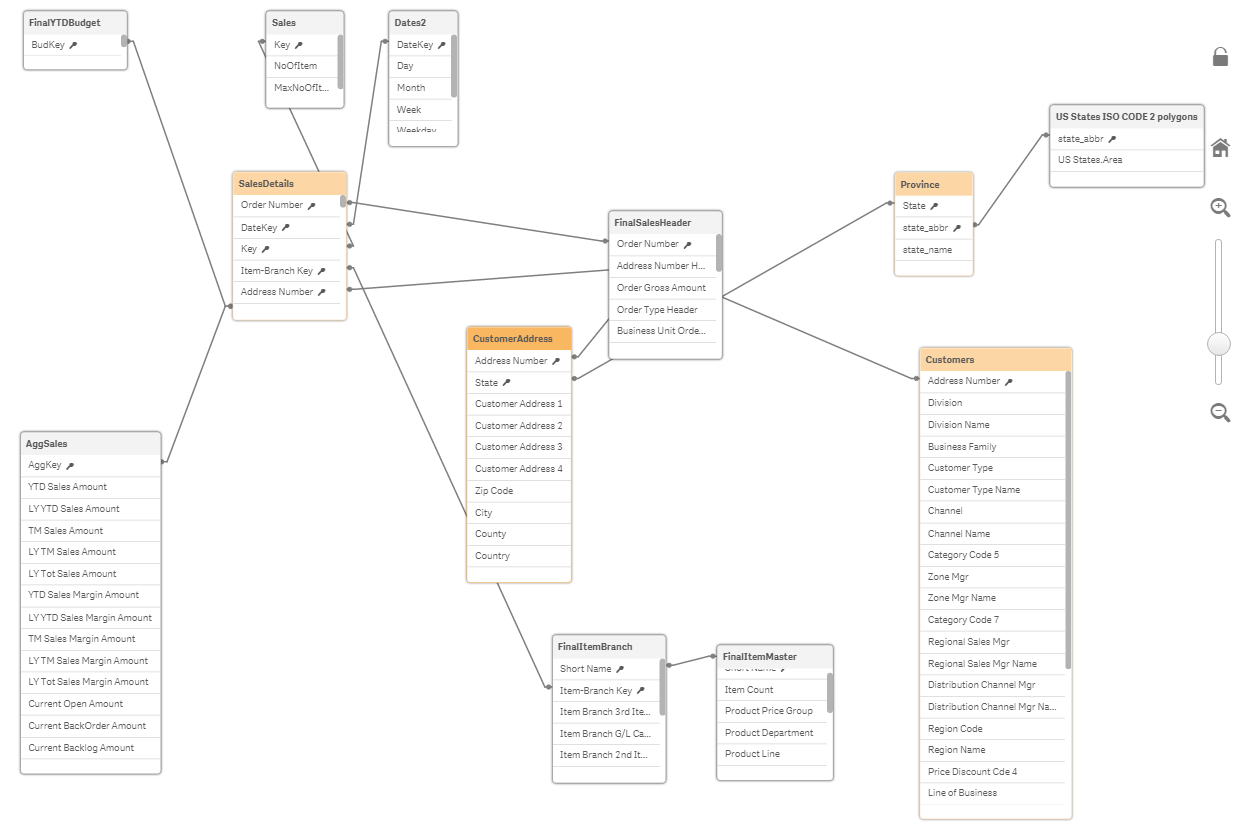
Click on the CustomerAddress table to see a highlighted expansion, via the state key, as shown:
The Data model viewer also provides information on the contents of each table.
Click the header of the customer address table, and then open the Preview pane by clicking the Preview button in the bottom-left corner.
The following preview will be displayed at the bottom of the screen:
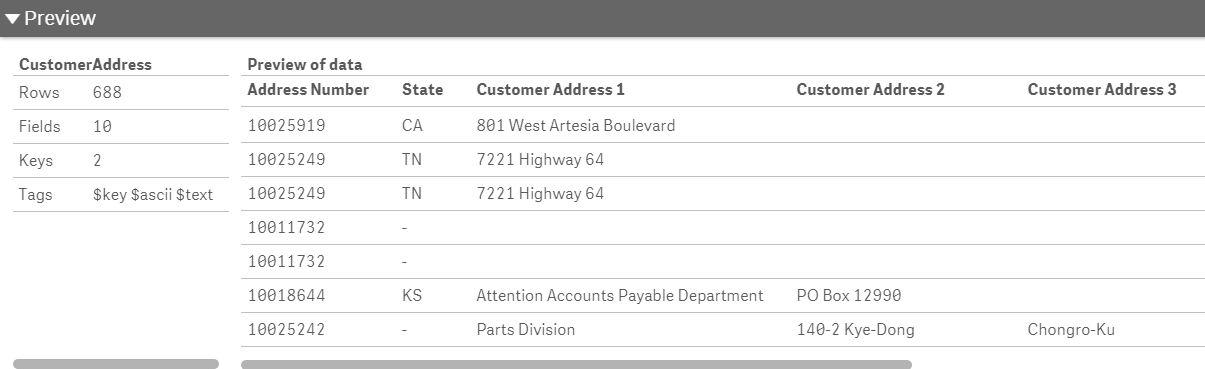
Along with a small snippet of the table's contents, the far-left table also provides some high-level table information about the number of rows, fields, keys, and any tags.
Next, click the Address Number field from the Customers table in the Data model viewer.
You can now see more detailed information about the individual field.
These are:
- Density
- Subset ratio
- Has duplicates
- Total distinct values
- Present distinct values
- Non-null values
- Tags
This information is very helpful when we are debugging issues. If a count does not return the expected result, you may want to ensure that there are no duplicates.
If a selection is not filtered correctly, you may want to check the subset ratio of the key and so on.