

As mentioned in the Creating a master library from the Data model viewer recipe, a great benefit of creating a master library is to save you time and reduce the complexity by applying global changes to your visualizations.
There are three main areas in the asset panel when editing a Qlik Sense sheet (Charts, Custom objects, Master items, and Fields). Clicking the chain button (

) opens the Master items pane.
From here, you can manage every aspect of the Master items, such as renaming, replacing, deleting, and editing.
You can continue to use the application from the Creating a Master Library from the Data model viewer recipe:
- If you have not completed the Creating a Master Library from the Data model viewer recipe, load the following in your
Data load editor:
LOAD * INLINE [
Country, Area, Quantity
USA, North, 1000
USA, North, 1200
USA, South, 2500
USA, South, 2500
UK, North, 1000
UK, North, 2500
UK, South, 2000
UK, South, 1900
 ];
- Add
CountryandAreaas Master dimensions, both with theGeotag. - Add
Quantityas a Master measure.
- Open the
App overviewscreen by clicking on the navigation dropdown on the toolbar at the top. - Create a new sheet or open an existing one.
- Enter the edit mode by clicking on the button.

- Click on the object pane button () and double-click on the
 button. The chart will be added to the main content area automatically.
- Type
Geoin the search box of the asset panel on the left of your screen. While there are no charts called Geo, the search has flagged up our two tagged dimensions in the master library pane with a yellow circle. - Drag the
Areafield to where it saysAdd dimension. Repeat the steps where theCountryfield selectsAdd "Country"when prompted, as shown in the following screenshot:
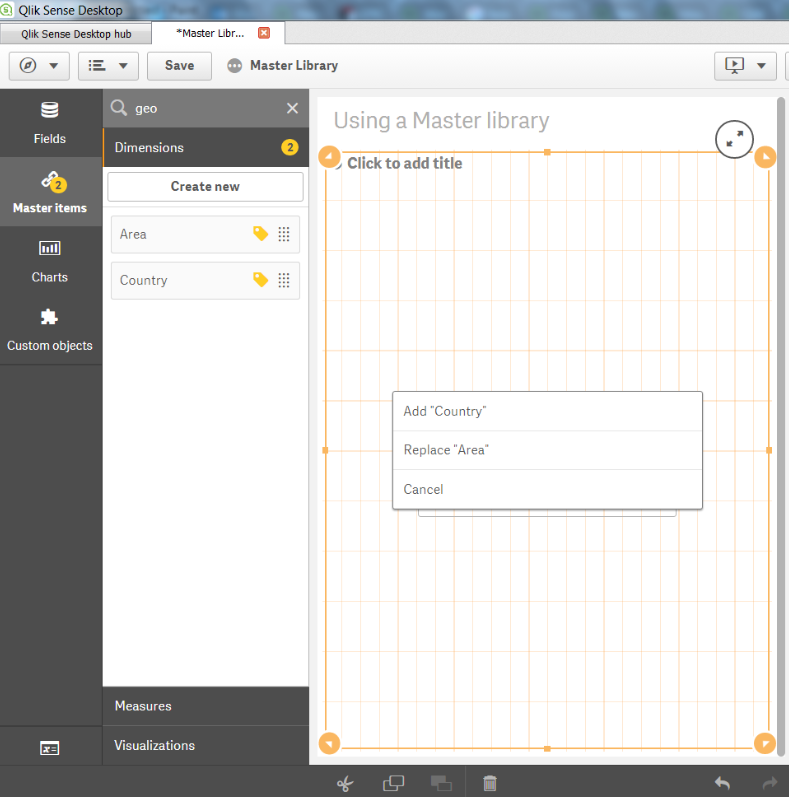
- Clear your search on
Geoby pressing thebutton.
- Click on
Measures.
- Drag the
Salesmeasure from the asset panel over to the add measure area of the chart. Voila! You have created your first visualization using Master dimensions and measures:
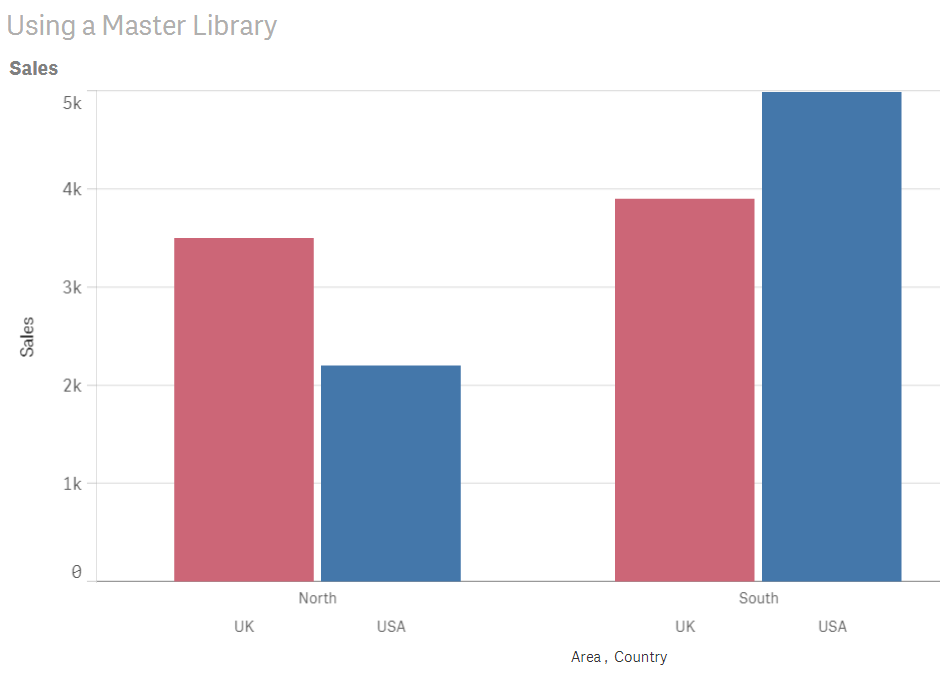
- You can now drag this chart into the asset panel and it will become a master visualization.
If you delete a Master dimension or Master measure, the visualizations that use the deleted Master item will not work unless you replace it with a new dimension or measure. The same applies to delete a field from the data model; the reference will remain part of the Master item pane until it's updated from the edit screen.
Creating master measures replaces the need to write expressions as variables for reuse. Another piece of QlikView functionality that has been replicated and expanded upon is the concept of linked objects. Any updates you make in the Master visualization area will be applied globally.
If you rename a field in your script without moving the position, it will be applied automatically to all the objects.