Book Image

Oracle Business Intelligence Enterprise Edition 11g: A Hands-On Tutorial

By : Christian Screen, Haroun Khan, Adrian Ward
Book Image

Oracle Business Intelligence Enterprise Edition 11g: A Hands-On Tutorial

By: Christian Screen, Haroun Khan, Adrian Ward

Overview of this book

<p>The Oracle Business Intelligence Enterprise Edition 11g (OBIEE) suite delivers a full range of analytic and reporting capabilities, coupled with powerful user experience for creating reports, dashboards and more with your business data. "<em>Oracle Business Intelligence Enterprise Edition 11g: A Hands-On Tutorial"</em> will have you unleashing that power in no time, helping you to take action and make the right decisions ataglance. <br /><br /><em>"Oracle Business Intelligence Enterprise Edition 11g: A Hands-On Tutorial"</em> provides you with valuable insight and the step-by-step know-how you need to take advantage of everything the Oracle BI suite has to offer you, all utilizing real world case studies for a true implementation in action.<br /><br /><em>"Oracle Business Intelligence Enterprise Edition 11g: A Hands- on Tutorial"</em> takes you on a journey right from inception to a full working OBI 11g System. Using a real-world data walkthrough you’ll explore topics like architecture, reporting and leveraging Essbase as a data source, as well as building the Oracle BI 11g metadata repository (RPD), and developing reports and dashboards in the new Fusion Middleware interface. This practical implementation guide equips you with from the coalface advice which will help you achieve a successful working application by journey’s end.</p>
Table of Contents (26 chapters)
Oracle Business Intelligence Enterprise Edition 11: A Hands-On Tutorial
Credits
About the Authors
About the Reviewers
www.PacktPub.com
Preface
Index

Creating an Analysis


So, we have discussed a little bit of the philosophy behind analytical reporting, and we will cover a bit more later, but let's first look at creating a technical example in OBIEE.

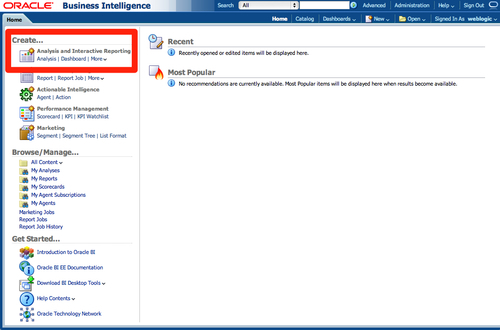
We start with a completely empty Presentation Catalog. In the previous chapter, we went through an overview of the catalog, and in this chapter we will be developing content via the Analysis and Interactive Reporting section that we have highlighted in the preceding screenshot.

To create a new report, we click on Analysis. We are then prompted with options, as shown in the screen below. If we have enabled direct SQL entry for a user, then we will have options to enter Logical or Physical SQL in order to query our data source. Otherwise, we will be prompted to choose from an available Subject Area.

Remember that we created an RPD complete with two subject areas in Chapter 8, Developing a BI Repository. We can create analyses from within either of these areas. So let's go ahead and choose the Tennis...