

Now that you have verified that your data is indexed successfully in Elasticsearch, we can go ahead and look at the Kibana interface to get some useful analytics from the data.
As described in Chapter 1, Introduction to ELK Stack, we will start the Kibana service from the Kibana installation directory:
$ bin/kibana
Now, let's see Kibana up and running with a screen similar to the following screenshot on the browser with this URL:
http://localhost:5601
We can verify our index and fields in the Settings page under the indices tab as follows:
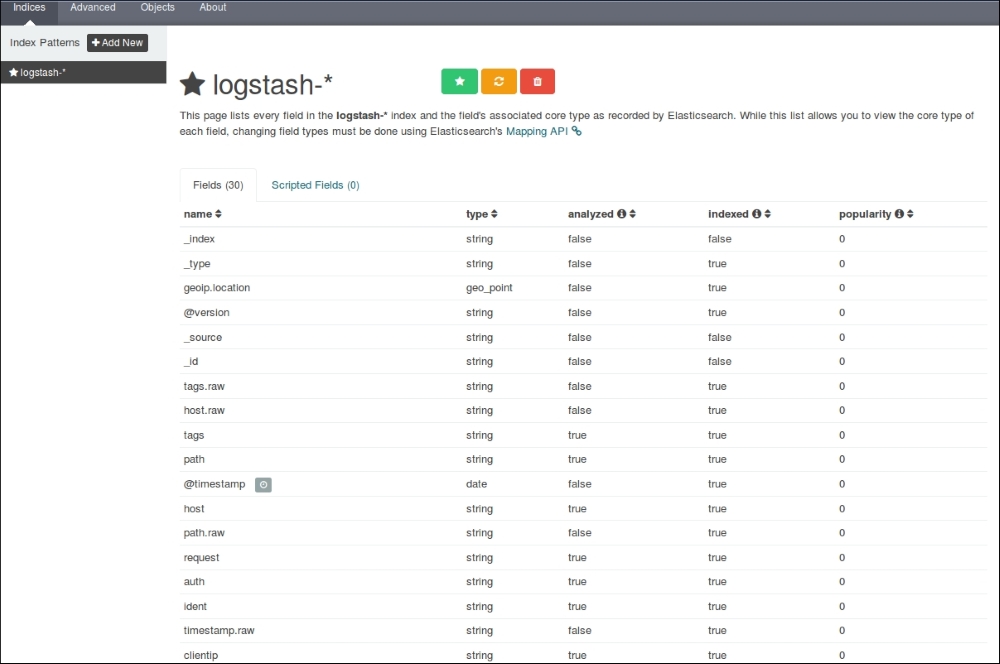
Kibana Settings page
It shows all our fields that were indexed, their data types, index status, and popularity value.
As we have already set up Kibana to take the logstash-* indexes by default, it starts to display the indexed data as a histogram of counts, and the associated data as fields in the JSON format as follows:
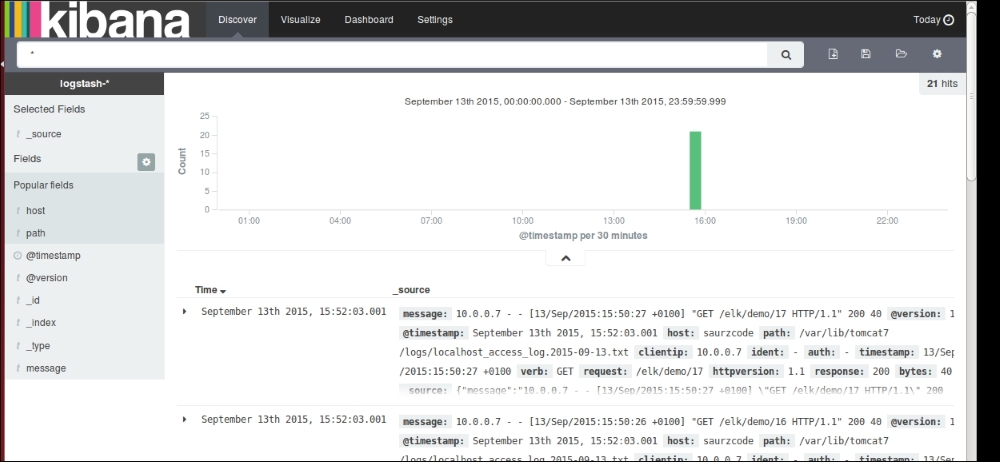
The Kibana Discover page showing indexed values