
In the previous sections, we leveraged plotting capability from the arules and igraph packages to plot induced rules. In this section, we introduce arulesViz, a package dedicated to plot association rules, generated by the arules package. The arulesViz package integrates seamlessly with the arules packages in terms of sharing data structures.
The following code is quite self-explanatory. A multitude of graphs, including interactive/non-interactive scatter plots, graph plots, matrix plots, and group plots can be generated from the rules data structure; it's a great visual way to explore the rules induced:
########################################################################
 #
 # R Data Analysis Projects
 #
 # Chapter 1
 #
 # Building Recommender System
 # A step step approach to build Association Rule Mining
 #
 # Script:
 #
 # RScript to explore arulesViz package
 # for Association rules visualization
 #
 # Gopi Subramanian
 #########################################################################
library(arules)
 library(arulesViz)
get.txn <- function(data.path, columns){
 # Get transaction object for a given data file
 #
 # Args:
 # data.path: data file name location
 # columns: transaction id and item id columns.
 #
 # Returns:
 # transaction object
 transactions.obj <- read.transactions(file = data.path, format = "single",
 sep = ",",
 cols = columns,
 rm.duplicates = FALSE,
 quote = "", skip = 0,
 encoding = "unknown")
 return(transactions.obj)
 }
get.rules <- function(support, confidence, transactions){
 # Get Apriori rules for given support and confidence values
 #
 # Args:
 # support: support parameter
 # confidence: confidence parameter
 #
 # Returns:
 # rules object
 parameters = list(
 support = support,
 confidence = confidence,
 minlen = 2, # Minimal number of items per item set
 maxlen = 10, # Maximal number of items per item set
 target = "rules"

 )

 rules <- apriori(transactions, parameter = parameters)
 return(rules)
support <- 0.01
 confidence <- 0.2
# Create transactions object
 columns <- c("order_id", "product_id") ## columns of interest in data file
 data.path = '../../data/data.csv' ## Path to data file
 transactions.obj <- get.txn(data.path, columns) ## create txn object
# Induce Rules
 all.rules <- get.rules(support, confidence, transactions.obj)
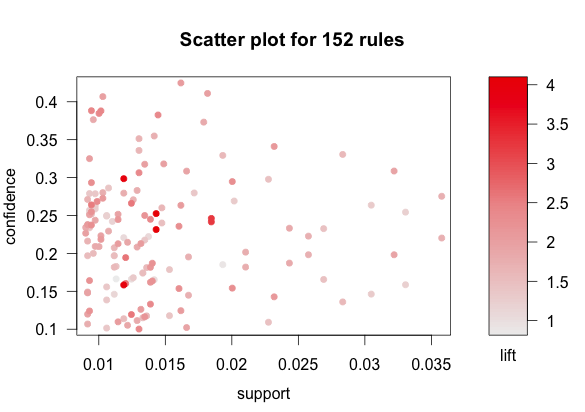
# Scatter plot of rules
 plotly_arules(all.rules, method = "scatterplot", measure = c("support","lift"), shading = "order")
# Interactive scatter plots
 plot(all.rules, method = NULL, measure = "support", shading = "lift", interactive = TRUE)
# Get top rules by lift
 sub.rules <- head(sort(all.rules, by="lift"), 15
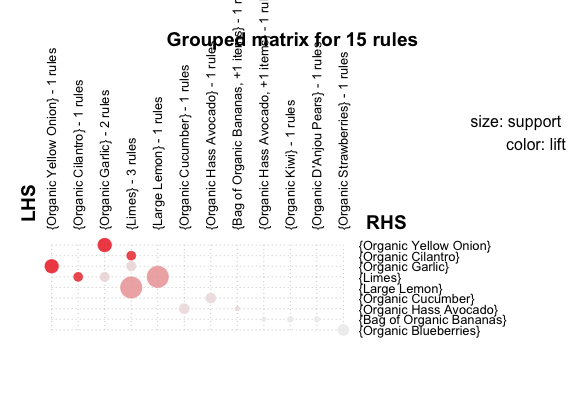
# Group plot of rules
 plot(sub.rules, method="grouped")
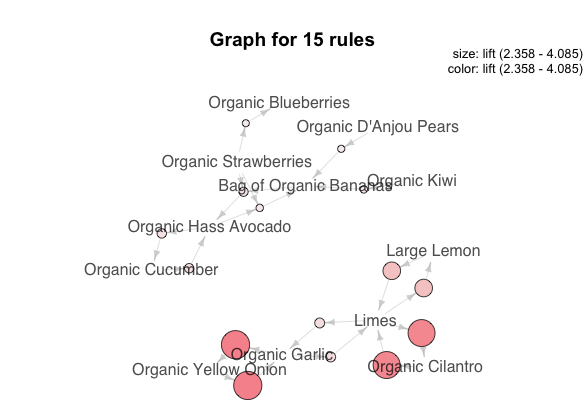
# Graph plot of rule
 plot(sub.rules, method="graph", measure = "lift")
The following diagram is the scatter plot of rules induced:
The following diagram is the grouped plot of rules induced:
The following diagram is the graph plot of rules induced: