

Other UI elements in KIE Sandbox
On the Decision Model page of KIE Sandbox, if we click on the Decision Navigator icon (the flag-like icon at the top right), KIE will show Decision Navigator, like in Figure 3.27:
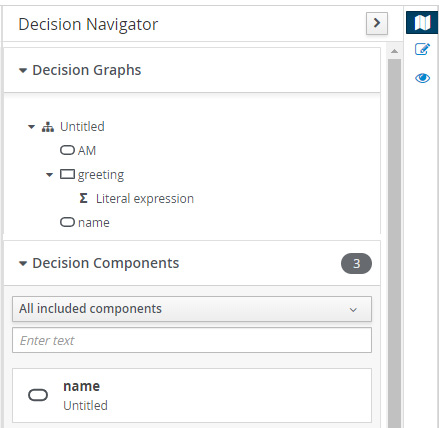
Figure 3.27 – Decision Navigator view
The Decision Navigator view is another layout to represent the same Decision Model – this time, as a tree-like structure. All the nodes are the same, but it is easier to see the content of the nodes (for example, when we use a literal expression to make our decision). Clicking on the elements in Decision Navigator will jump to the relevant part of the diagram.
Also on the right-hand side of the screen is Explore diagram. The icon looks like an eye, as highlighted in Figure 3.28:
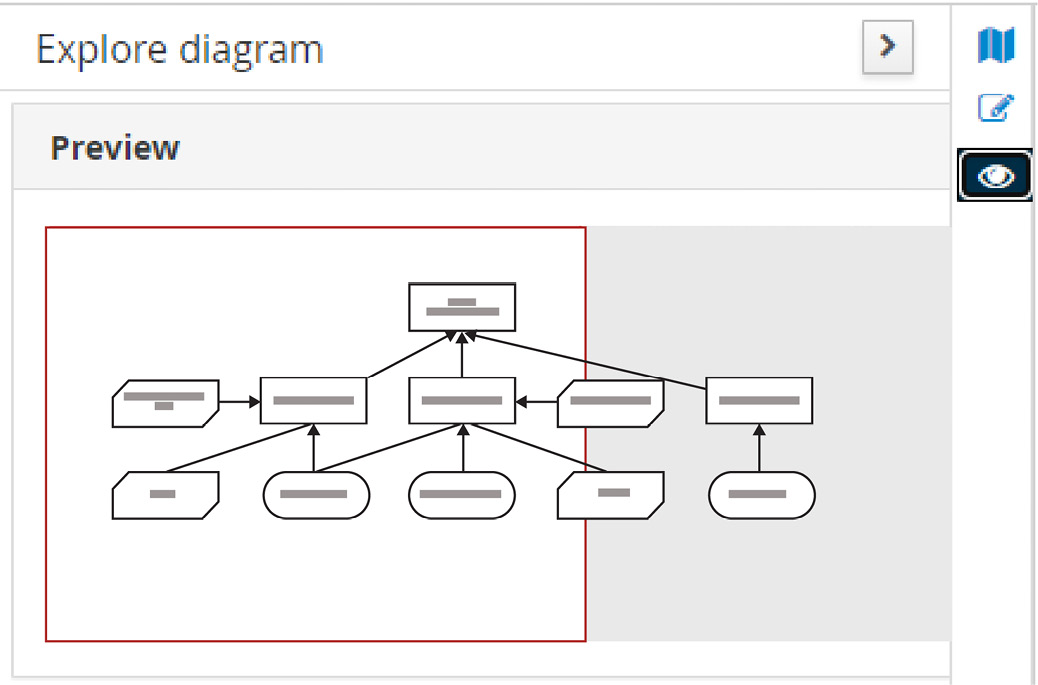
Figure 3.28 – Explore diagram
Explore diagram is really useful for exploring larger decision models – which is why Figure 3.28 shows the more complicated sample Decision...