
As you know, Oracle Essbase comes with an add-in tool designed to be used in Microsoft Excel. It is this add-in that is one of Essbase's biggest strengths. As you also know, it is this add-in that makes all of the various data analysts very happy as well.
Oracle, being the industry leader, they are, did not stop with the Essbase Add-in for Microsoft Excel. They realized that in addition to making the data analysts happy, it would probably be a good idea to make the flash and dash executives happy as well.
Oracle has introduced, with Essbase version 9.x, a new product called Smart View. Oracle Smart View, simply put, is like an Essbase Add-in for the entire Microsoft Office suite of applications.
In today's world of on demand this and real time that, just imagine a tool that allows you to go into a meeting with your beautifully prepared Microsoft PowerPoint presentation that is directly connected to the Essbase database. Your presentation will always have up-to-the-second and accurate data. Also imagine that you need to send a quick email to your team alerting them to some data condition that needs immediate attention. Well, your email can also connect directly to the Essbase database and will contain upto the second data!
Wait, there's more! No more trying to hastily update Microsoft Word documents in a pinch either. You guessed it, embedded into your document is a dynamic connection to the Essbase database!
Oh, and in case you are wondering, Oracle Smart View works effortlessly with Microsoft Excel too! Does it get any better than this?
Smart View is like having your cake and being able to eat it too! Now, let's jump in and see how we can make the best use of Oracle Smart View for reporting your data.
The installation of Smart View is very easy. Along with Oracle Smart View, you will also need to install Oracle Shared Services, formerly the Oracle Hub, or Oracle Provider Services. Smart View can be used with all Oracle products, such as Essbase, Oracle Planning, and Financial Reporting.
When installing Oracle Smart View in Microsoft Excel, there is no need to uninstall the Essbase Add-In, you can simply install right on top of it. After Smart View is installed you should see an Hyperion menu pick on the main toolbar in Microsoft Excel, this will be in addition to the Essbase menu pick. You should now also see the Hyperion menu pick on the toolbars for Microsoft Word, Microsoft PowerPoint, and on any of the other Microsoft Office components you have installed on your computer.
By clicking on the Hyperion menu pick added to your toolbar, you see a listing of the entire menu available to you as shown in the following screenshot:
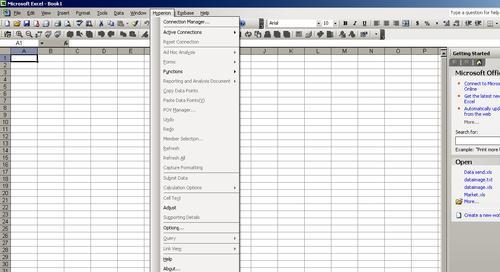
Before you can even begin to retrieve data from your Essbase database or through your Oracle Planning module, you will need to define a data source to Smart View for each connection. This needs to be done individually for each Microsoft Office application in which you will be using Smart View.
To add a data source, click on Hyperion | Connection Manager.
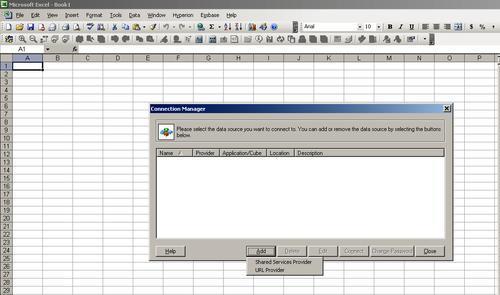
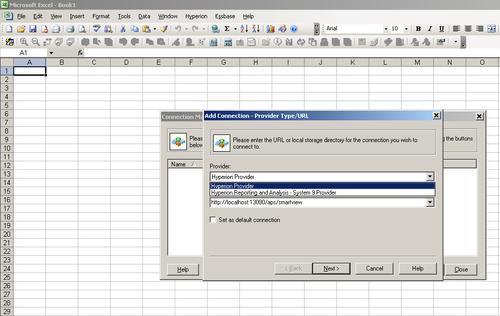
You will then be asked to connect using either Shared Services Provider or URL Provider. In this example, we have chosen URL Provider and in the next screen you see a list box with several URL locations.
In the list box, you will see Hyperion Provider and Hyperion Reporting and Analysis. To connect to Essbase, Oracle Planning, or Oracle Financial Management use URL Provider and for Financial Reporting, Production Reporting, or Web Analysis use Hyperion Reporting and Analysis. Since we are connecting to Essbase, we have selected URL Provider.
For URL Location, you need to provide the location where Hyperion Provider is actually running. If your Hyperion Provider is installed on your client, then it would be running on your localhost and you need to provide the URL address.
For Essbase, the default URL location is:
http://localhost:13080/aps/SmartView
For Oracle Planning, the default URL location is:
http://localhost:8300/HyperionPlanning/SmartView
Once the Provider and URL Location are entered, please click on the Next button to proceed.
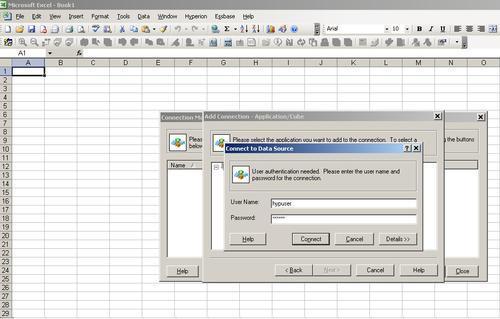
On the next screen you will see the Essbase server. When you click on the server the system will prompt you to enter your Essbase user name and password to connect to the Essbase server as shown in the following screenshot:
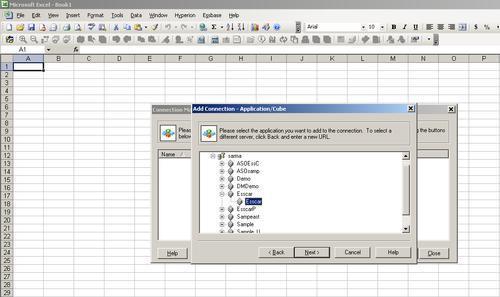
After you have entered your user ID and password click on the Connect button and in the next screen you will see a list of the available applications and databases on the Essbase server. Select the application and database to which you want to establish the connection and click on Next.
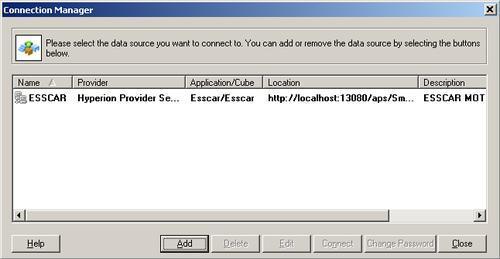
On the next screen, you will be prompted to enter a Name and Description for the data source. When you have entered this information click on the Finish button and you are now done. You have successfully added a new data source for Smart View. To connect to this data source click on the Connect button as shown in the following screenshot:
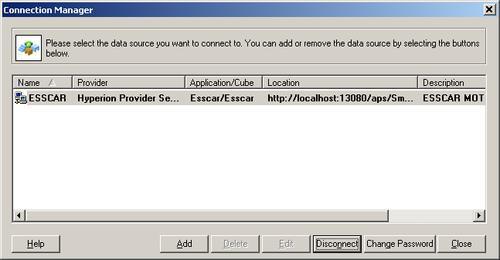
In order to establish a connection to the Essbase server, you will be asked to enter your user name and password. Once you have entered the correct information, you can click on the Connect button and you will be successfully connected to the Essbase cube. You are now ready for happy reporting. The following screenshot shows the connection manager after the connection is established:
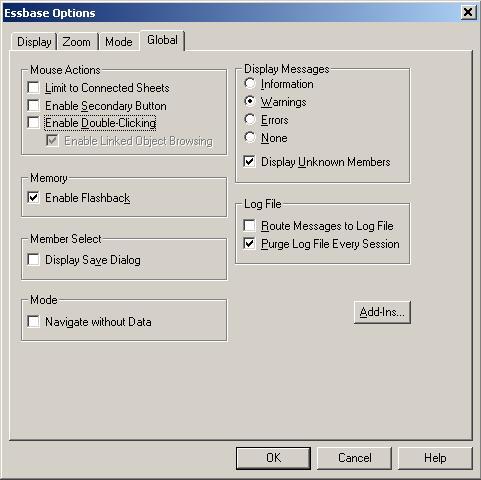
If you have the Essbase Add-in installed on the same PC, we need to remove the Enable Double-Clicking option from the Essbase | Options | Global tab in Microsoft Excel.
Steps to update the Essbase Add-in option:
1. Open Microsoft Excel and click on Essbase | Options.
2. Click on the Global tab.
3. Uncheck the Enable Double-Clicking checkbox.
4. Click on OK.
The next screenshot shows the Essbase | Options | Global tab and I assume you are quite familiar with this screen, as we have discussed it in the add-in section of this book:
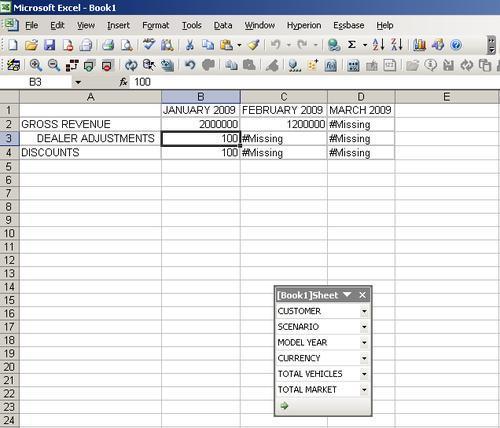
Now that you have established a connection with the Essbase server, you are ready to retrieve data. With Smart View, you can generate reports using the Free Form or you can do your own Ad-Hoc reporting. Using the Free Form reporting option, like we talked about for the Microsoft Excel Add-in, you can define the row and column member names and click on the Hyperion | Refresh button and you will see the data as shown in the following screenshot:
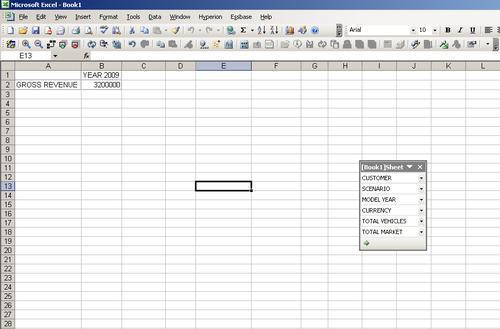
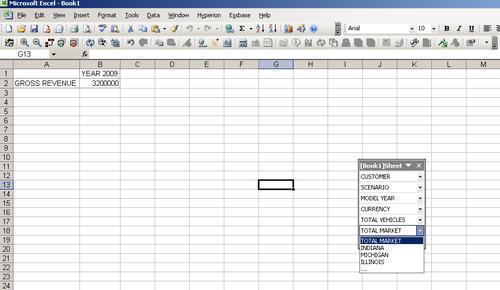
If you notice in the previous figure, you see a small box called [Book1]Sheet that is nothing but a POV (Point of View). The POV has all of the page dimension information for the data you are currently looking at. Right now, you are viewing data for TOTAL MARKET and you decide that you would like to see the data at a specific market level. On the POV screen, you can click on the TOTAL MARKET drop-down box and then click on the ... and you will see the following Member Selection screen:
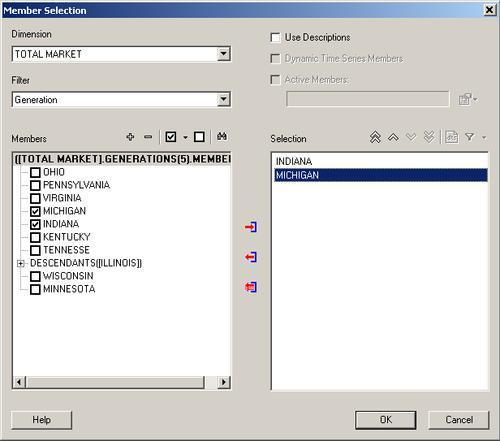
In the Member Selection screen, you can see all of the available members for the dimension you have selected listed in the Members list box (which is on the left hand part of the Member Selection screen) and you can see all of the members you have selected in the Selection list box (right-hand side of the Member Selection screen). In the Member Selection screen, you can also select different dimensions by clicking on the Dimension drop-down list. You can also set Filters for the members you have selected to narrow your selection further. The filter can be at the Children, Descendants, Level, or Generation of the member you have selected.
In this example, we have filtered the selection by the Generation and displayed the report of all of the members in Generation 5. Select all returned members by clicking on the select all button and then click on the add button
 to add the members into the selection list. Click on OK to return back to Microsoft Excel.
On the Microsoft Excel sheet, click the refresh button  on the POV. The data will then be refreshed.
As you can see in the selection above, we have selected three members from the market dimension. This will not report the data in three separate sheets, but the members are stored in the POV and you can change the member in the POV anytime and click on the refresh button to refresh the data.
The Free Form reporting is the same as the Free Form reporting that we have talked about previously in the chapter on the Essbase Add-In. However, the difference is that in Smart View, you will have a POV selection through which you can change your other member selections. In the next section, we will learn little more about the POV Manager.
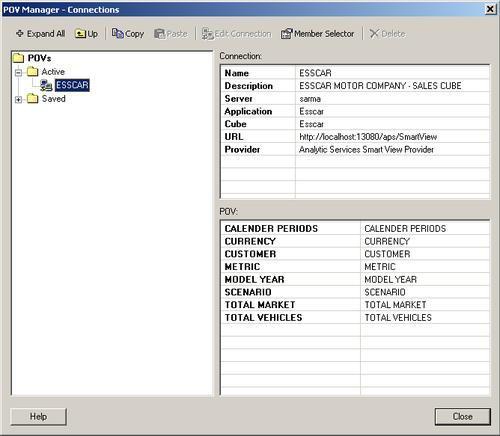
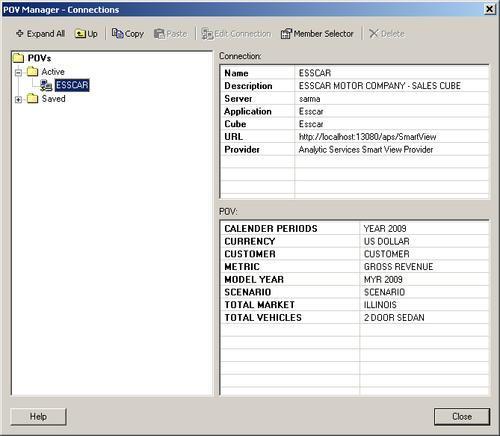
You can also report the data in Microsoft Excel using the POV Manager. Once you have established a connection to the Essbase database, click on Hyperion | POV Manager. The POV Manager screen will be opened and you will see two folders, one is called Active and the other is called Saved.
If you click on the Active folder you will see the current active connections. If you are connected to two data sources you will see two connection names in the Active folder. If you select a connection now in the right side of the POV Manager, you will have two selections, one is the Connection and the other is POV (seen in the following screenshot). In the Connection block you will see information about the data source that this connection is associated with and in the POV block you will see all of the dimension information along with the default members selected. On the POV block the left side is the dimension information and right-hand side is the selected member information. If you double-click a member in the POV, the Member Selection screen will be displayed and you can change the member information.
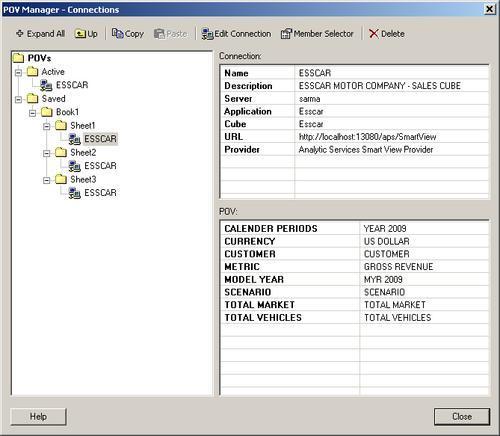
In the Saved folder, you have a folder which has the same name as the Microsoft Excel workbook name and inside that folder there are three folders called Sheet 1, Sheet 2, and Sheet 3. These folders correspond with the number of sheets in your workbook. Inside each individual sheet folder you can save the connection information and POV for that sheet. Once you save the Microsoft Excel file the connection information is also saved and this can be used by the business user to save and then share their queries with other users.
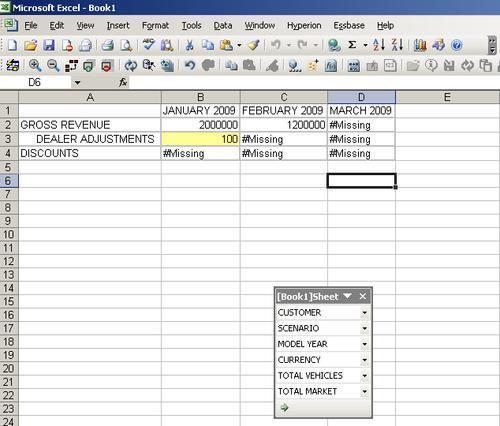
Like the "Lock and Send" data update method in the Essbase Add-in, you can also send data to the Essbase database by clicking on the Hyperion | Submit Data button. Let's say we have a member called Dealer Adjustments in our Measures dimension and we allow the business analysts to enter adjustments to this member using Microsoft Excel. All they need to do is click on Submit Data to send the data to the Essbase database. The moment the business analyst enters the January 2009 Dealer Adjustments data in Microsoft Excel, the spreadsheet cell shows the information in yellow, indicating that this information has been edited and needs to be sent to the server, as shown in the next screenshot:
The moment the user clicks on the Hyperion | Submit Data, the information is submitted to the Essbase database as shown:
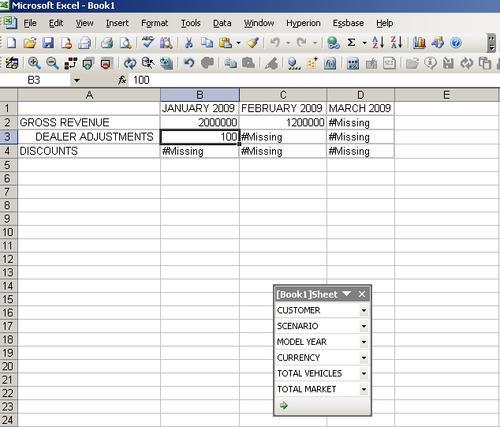
As you can see from the previous screenshot, the data is submitted to the database server but the data has not been rolled upto its parent which is TOTAL DISCOUNTS. In order to roll up the data, you need to execute a calc script.
Click on the Hyperion | Calculation Options | Calculate and you will see the calculation scripts screen as shown:
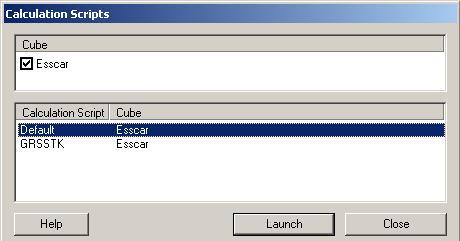
In this screen you can see all of the available Calculation Scripts for the Essbase database you are connected to. In this case we select the default calc and click on Launch. When the Calc has completed, the data is rolled upto the higher parent levels. If you run the report for the TOTAL DISCOUNTS now, you will see the data is rolled up as shown in the following screenshot:
This is one of the coolest features in Smart View. When you install Smart View, it will be integrated into all of the Microsoft Office products loaded on your PC. If you open Microsoft Word you will see a Hyperion menu item, open Microsoft PowerPoint and you will see a Hyperion menu pick, what the heck, you will even see the Hyperion menu pick in your Microsoft Outlook mail program.
Let's say you are meeting with the Finance Director monthly, to show how good or bad the company is doing in the current market. This is never a fun task. Chances are you will create a Microsoft PowerPoint presentation. With Smart View, all you need to do is just click to refresh the data every month and you will get the most current data from the Essbase database into your presentation.
Let's see how we can do this in Smart View. There are a couple of ways to do it. You can copy the data point from Microsoft Excel and paste it into the Microsoft PowerPoint presentation or just create a new data point in the Microsoft PowerPoint presentation. It's that easy!
1. First, explore how we can do it by copying the Data Points from Microsoft Excel to Microsoft PowerPoint.
2. Select the cell whose data point you want to copy and click on Hyperion | Copy Data Points.
3. Open the Microsoft PowerPoint in the menu item and click on Hyperion | Paste Data Points.
You will now see a message on the Microsoft PowerPoint screen saying NEED REFRESH as shown in the following screenshot:
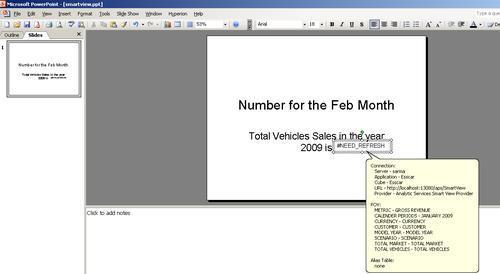
If you look closely at the previous screenshot, you will see the connection detail which tells you all of the information about the members that are chosen for this Data Point. Since your connection is already established in Microsoft Excel, you do not need to reconnect in Microsoft PowerPoint. In order to see the new data, click on Hyperion | Refresh, you will see the data in Microsoft PowerPoint (as seen below) and you are now ready for the meeting.

Another way of calling the Essbase data from other Microsoft Office products is by using the Smart Tags option. These Smart Tags are turned off by default but you can always turn them on.
On the Tools menu, click on the Auto Correct Options, and then click on the Smart Tags tab and select the Label Text with Smart Tags checkbox to enable the Smart Tags.
Now that the Smart Tags are enabled, let's modify our Microsoft PowerPoint presentation to show the data by Market. In Microsoft PowerPoint, just enter SmartView and you will see a small i on the top of the Smart View as shown in the following screenshot:
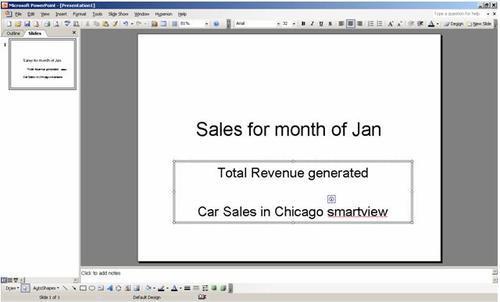
Click on the "i" tag and then click on the Functions | Connection Name (Esscar) | HsGetValue option. This function is used to return a data point for all of the members you have selected. Upon clicking on this, you will see a Member Selection screen where you can make all of the selections as shown in the next screenshot:
Click on OK after you have made all of the selections you need and you will see the data pulled into your Microsoft PowerPoint presentation (as seen below):

Well that wraps it up for Hyperion Smart View. With the already outstanding Essbase Add-in for Microsoft Excel and now the addition of Smart View there is virtually no limit to what you can do in the world of Business Intelligence.
Stay tuned as Oracle has even more new and exciting products coming down the pipe.