Book Image

Network Analysis using Wireshark 2 Cookbook - Second Edition

By : Nagendra Kumar Nainar, Yoram Orzach, Yogesh Ramdoss
Book Image

Network Analysis using Wireshark 2 Cookbook - Second Edition

By: Nagendra Kumar Nainar, Yoram Orzach, Yogesh Ramdoss

Overview of this book

This book contains practical recipes on troubleshooting a data communications network. This second version of the book focuses on Wireshark 2, which has already gained a lot of traction due to the enhanced features that it offers to users. The book expands on some of the subjects explored in the first version, including TCP performance, network security, Wireless LAN, and how to use Wireshark for cloud and virtual system monitoring. You will learn how to analyze end-to-end IPv4 and IPv6 connectivity failures for Unicast and Multicast traffic using Wireshark. It also includes Wireshark capture files so that you can practice what you’ve learned in the book. You will understand the normal operation of E-mail protocols and learn how to use Wireshark for basic analysis and troubleshooting. Using Wireshark, you will be able to resolve and troubleshoot common applications that are used in an enterprise network, like NetBIOS and SMB protocols. Finally, you will also be able to measure network parameters, check for network problems caused by them, and solve them effectively. By the end of this book, you’ll know how to analyze traffic, find patterns of various offending traffic, and secure your network from them.
Table of Contents (20 chapters)

Capturing data on virtual machines

Getting ready

In the last few years, a significant amount of servers are moving to virtual environments—that is a large amount of servers on a single hardware device.

First, to put some order in the terms. There are two major terms to remember in the virtual world:

  • A virtual machine is an emulation of a computer system that is installed on single or multiple hardware platforms. A virtual machine is mostly used in the context of virtual servers. The major platforms used for server virtualization are VMware ESX, Microsoft Hyper-V, or Citrix XenServer.
  • A Blade server is a cage that holds inside server cards and LAN switches to connect them to the world.

In this section, we will look at each one of these components and see how to monitor each one of them.

How to do it...

Let's see how to do it.

Packet capture on a VM installed on a single hardware

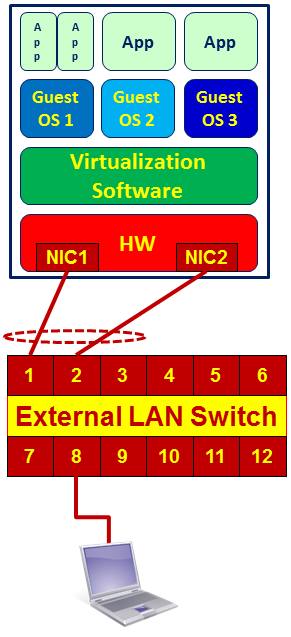
A single hardware with virtual machines is illustrated in the following diagram:

As you see in the preceding diagram, we have the applications that run on the operating systems (guest OS in the drawing). Several guest OSs are running on the virtualization software that runs on the hardware platform.

As mentioned earlier in this chapter, in order to capture packets we have two possibilities: to install Wireshark on the device that we want to monitor, or to configure port mirror to the LAN switch to which the Network Interface Card (NIC) is connected.

For this reason, in the case of a virtual platform on a single hardware, we have the following possibilities:

  1. Install Wireshark on the specific server that you want to monitor, and start capturing packets on the server itself.
  2. Connect your laptop to the switch 8, and configure a port mirror to the server. In the preceding diagram, it would be to connect a laptop to a free port on the switch, with a port mirror to ports 1 and 2. The problem that can happen here is that you monitor.

The first case is obvious, but some problems can happen in the second one:

  1. As illustrated in the preceding diagram, there are usually two ports or more that are connected between the server and the LAN switch. This topology is called Link Aggregation (LAG), teaming, or if you are using Cisco switches, EtherChannel. When monitoring a server, check whether it is configured with load sharing or port redundancy (also referred to as Failover). If it is configured with port redundancy, it is simple: check what the active port is and configure the port mirror to it. If it is configured with load sharing, you have to configure one of the following:
    • Port mirror to LAG interface: that is, port mirror to the virtual interface that holds the two or more physical interfaces. Usually, it is termed by the switch vendor as Port-Group or Port-Channel interface.
There are various terms for grouping several ports into one aggregate. The most common standard is 802.3ad (LAG), later replaced by 802.3AX LAG. There is also Cisco EtherChannel, and server vendors call it teaming or NIC teaming (Microsoft), bonding (various Linux systems), Load Based Teaming (LBT), and other terms. The important thing is to check whether it is a load sharing or redundant configuration. Note that the mechanism used in all the mechanisms is sharing and not balancing, and this is because the load is not equally balanced between the interfaces.
    • The server NICs are configured in the port redundancy: the port mirror from one port to two physical ports (in the diagram to ports 1 and 2 of the switch).
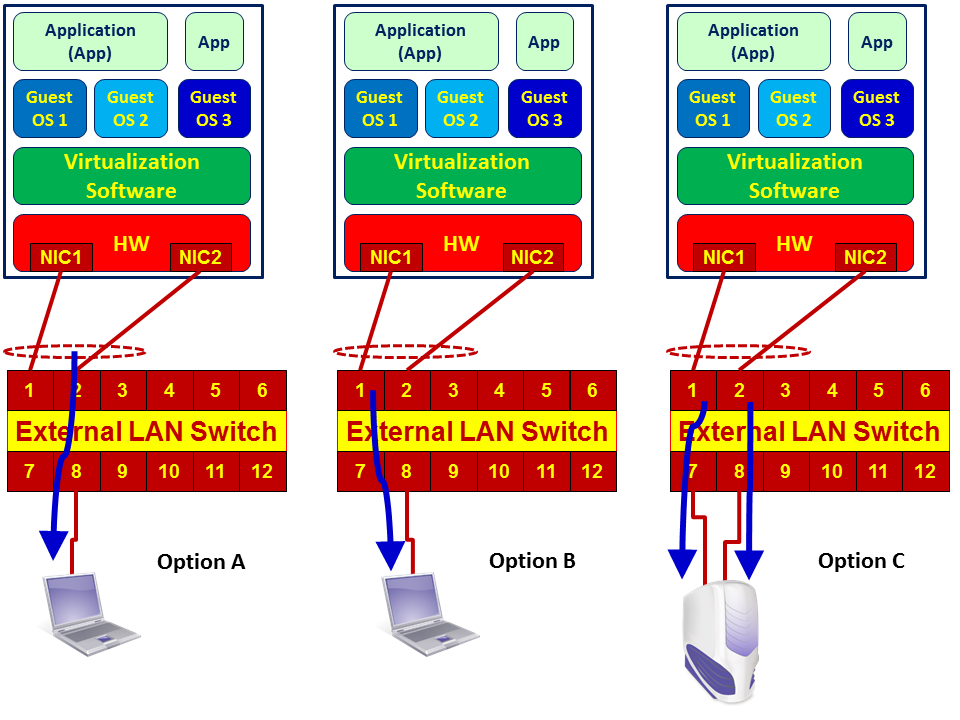
    • Configure two port mirrors from two interface cards on your PC to the two interfaces on the LAN switch at the same time. A diagram of the three cases is presented here:
    • There is another problem that might happen. When monitoring heavy traffic on ports configured with load sharing, in Option A you will have a mirror of two NICs sending data to a single one, for example, two ports of 1 Gbps to a single port of 1 Gbps. Then of course, in case of traffic that exceeds the speed of the laptop, not all packets will be captured and some of them will be lost. For this reason, when you use this method, make sure that the laptop has a faster NIC than the monitored ports or use Option C (capture with two interfaces).
In any case, Wireshark is not suitable for high-rate packet capture and will not suit more then 200-300 Mbps, so when monitoring heavy traffic, configure the capture filters or use commercial software that is suitable.

Packet capture on a blade server

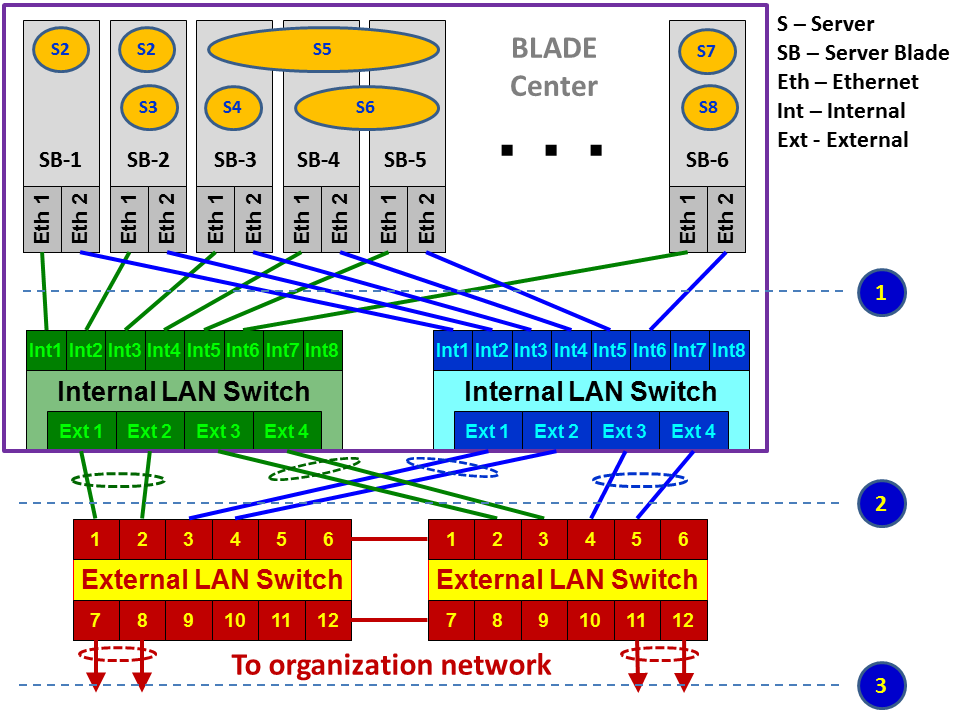
In the case of using a BLADE Center, we have the following hardware topology:

As illustrated, we have a BLADE Center that contains the following components:

  • Blade servers: These are hardware cards, usually located at the front side of the blade.
  • Servers: The virtual servers installed on the hardware servers, also called VMs.
  • Internal LAN switch: Internal LAN switches that are installed at the front or back of the blade center. These switches usually have 12-16 internal or virtual ports (Int in the diagram) and 4-8 external or physical ports (Ext in the diagram).
  • External switch: Installed in the communication rack, and it's not a part of the BLADE Center.

Monitoring a blade center is more difficult because we don't have direct access to all of the traffic that goes through it. There are several options for doing so:

  • Internal monitoring on the blade center:
    • For traffic on a specific server, install Wireshark on the virtual server. In this case you just have to make sure from which virtual ports traffic is sent and received. You will see this in the VM configuration, and also choose one interface a the time on the Wireshark and see to which one the traffic goes.
    • A second option is to install Wireshark on a different VM and configure the port mirror in the blade center switch, between the server you wish to monitor and the VM with the Wireshark installed on it.
  • From servers to blade center switch (1) in the previous diagram:
    • For traffic that goes from the servers to the switch, configure, port mirror from the virtual ports the server is connected to, to the physical port where you connect the laptop. Most vendors support this option, and it can be configured.
  • For external monitoring, traffic from the internal blade center switch to the external switches:
    • Use a standard port mirror on the internal or external switches

How it works...

As described before, there are several types of virtual platforms. I will explain the way one operates on VMware, which is one of the popular ones.

On every virtual platform, you configure hosts that are provided with the CPU and memory resources that virtual machines use and give virtual machines access to these resources.

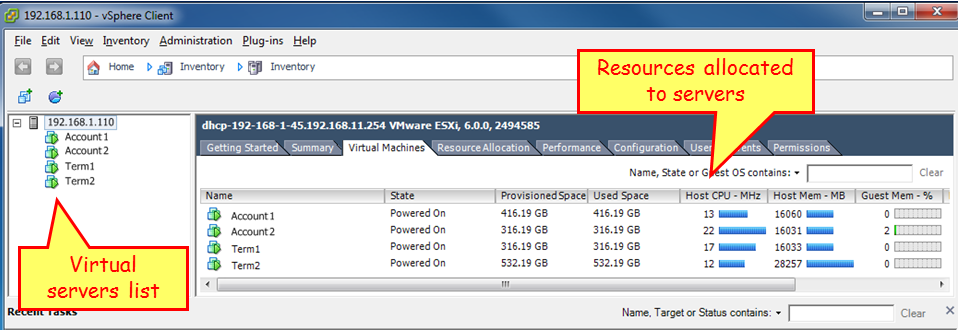
In the next screenshot, you see a virtualization server with address 192.168.1.110, configured with four virtual machines: Account1, Account2, Term1, and Term2. These are the virtual servers, in this case, two servers for accounting and two terminal servers:

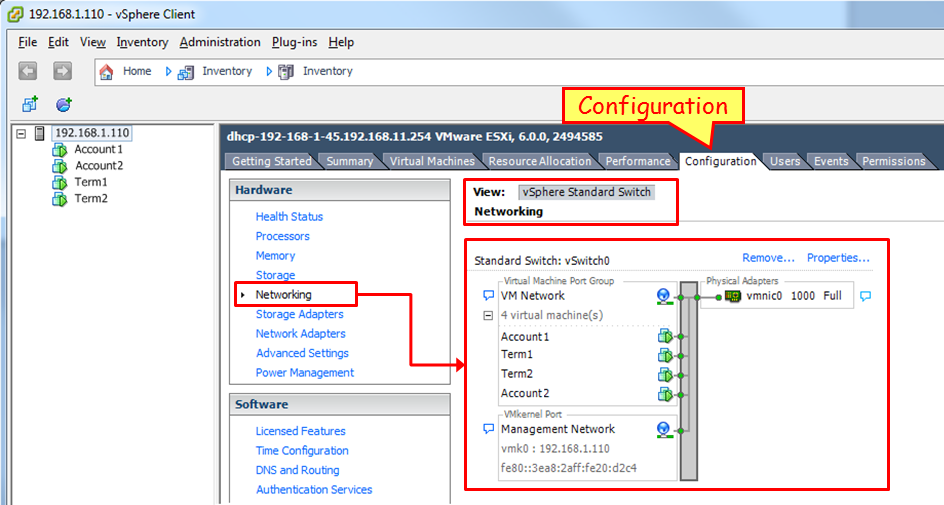
When you go to the configuration menu and choose Networking, as illustrated in the next screenshot, you see the vSwitch. On the left, you see the internal ports connected to the servers, and on the right, you see the external port.

In this example, we see the virtual servers Account1, Account2, Term1 and Term2; on the right, we see the physical port vmnic0.

Standard and distributed vSwitch

The VMware platform vSphere offers two kinds of virtual switches, standard and distributed:

  • The standard vSwitch is what every vSphere installation has, no matter what license it is running on
  • Distributed vSwitches are only available for those who have an Enterprise Plus license

Port mirror is enabled in distributed vSwitch; how to configure it? You can find that out in the Working With Port Mirroring section on the VMware vSphere 6.0 documentation center: http://pubs.vmware.com/vsphere-60/index.jsp#com.vmware.vsphere.networking.doc/GUID-CFFD9157-FC17-440D-BDB4-E16FD447A1BA.html.

See also