-
Book Overview & Buying
-
Table Of Contents

Learning Predictive Analytics with R
By :
Learning Predictive Analytics with R
By:
Overview of this book
This book is packed with easy-to-follow guidelines that explain the workings of the many key data mining tools of R, which are used to discover knowledge from your data.
You will learn how to perform key predictive analytics tasks using R, such as train and test predictive models for classification and regression tasks, score new data sets and so on. All chapters will guide you in acquiring the skills in a practical way. Most chapters also include a theoretical introduction that will sharpen your understanding of the subject matter and invite you to go further.
The book familiarizes you with the most common data mining tools of R, such as k-means, hierarchical regression, linear regression, association rules, principal component analysis, multilevel modeling, k-NN, Naïve Bayes, decision trees, and text mining. It also provides a description of visualization techniques using the basic visualization tools of R as well as lattice for visualizing patterns in data organized in groups. This book is invaluable for anyone fascinated by the data mining opportunities offered by GNU R and its packages.
Table of Contents (18 chapters)
Preface

 Free Chapter
1. Setting GNU R for Predictive Analytics
2. Visualizing and Manipulating Data Using R
3. Data Visualization with Lattice
4. Cluster Analysis
5. Agglomerative Clustering Using hclust()
6. Dimensionality Reduction with Principal Component Analysis
7. Exploring Association Rules with Apriori
8. Probability Distributions, Covariance, and Correlation
9. Linear Regression
10. Classification with k-Nearest Neighbors and Naïve Bayes
11. Classification Trees
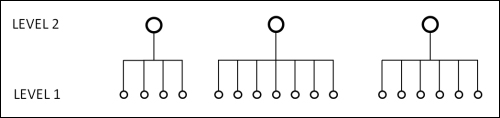
12. Multilevel Analyses
13. Text Analytics with R
14. Cross-validation and Bootstrapping Using Caret and Exporting Predictive Models Using PMML
B. Further Reading and References
Index