Book Image

Mastering Scientific Computing with R

Book Image

Mastering Scientific Computing with R

Overview of this book

Table of Contents (17 chapters)
Mastering Scientific Computing with R
Credits
About the Authors
About the Reviewers
www.PacktPub.com
Preface
Index

Chapter 
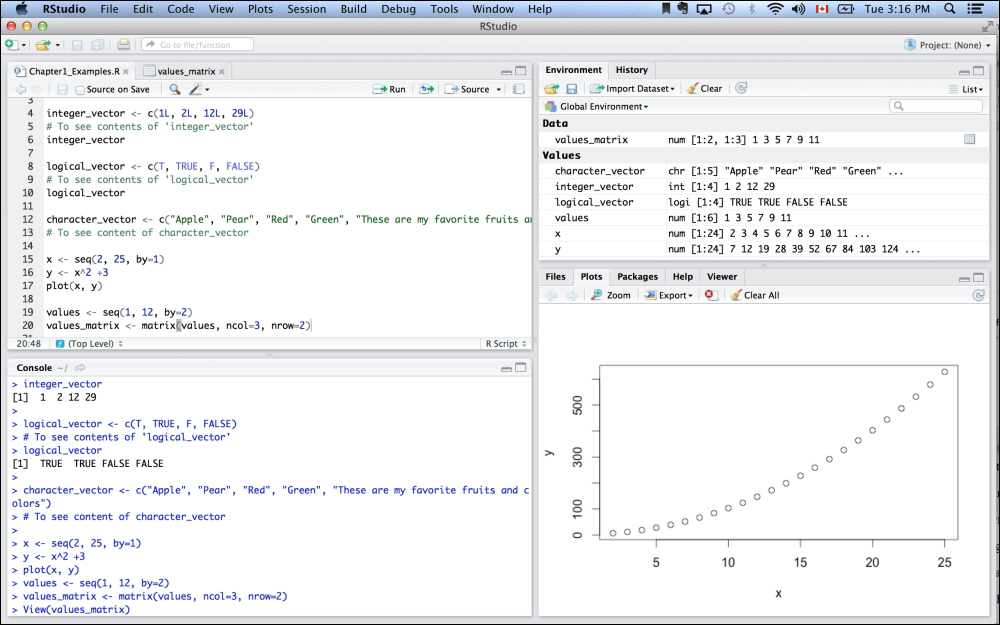
1. Programming with R

Scientific computing is an informatics approach to problem solving using mathematical models and/or applying quantitative analysis techniques to interpret, visualize, and solve scientific problems. Generally speaking, scientists and data analysts are concerned with understanding certain phenomena or processes using observations from an experiment or through simulation. For example, a biologist may want to understand what changes in gene expression are required for a normal cell to become a cancerous cell, or a physicist may want to study the life cycle of galaxies through numerical simulations. In both cases, they will need to collect the data, and then manipulate and process it before it can be visualized and interpreted to answer their research question. Scientific computing is involved in all these steps.

R is an excellent open source language for scientific computing. R is broadly used in companies and academics as it has great performance value and provides a cutting-edge software environment. It was initially designed as a software tool for statistical modeling but has since then evolved into a powerful tool for data mining and analytics. In addition to its rich collection of classical numerical methods or basic actions, there are also hundreds of R packages for a wide variety of scientific computing needs such as state-of-the-art visualization methods, specialized data analysis tools, machine learning, and even packages such as Shiny to build interactive web applications. In this book, we will teach you how to use R and some of its packages to define and manipulate your data using a variety of methods for data exploration and visualization. This book will present to you state-of-the-art mathematical and statistical methods needed for scientific computing. We will also teach you how to use R to evaluate complex arithmetic expressions and statistical modeling. We will also cover how to deal with missing data and the steps needed to write your own functions tailored to your analysis requirements. By the end of this book, you will not only be comfortable using R and its many packages, but you will also be able to write your own code to solve your own scientific problems.

This first chapter will present an overview of how data is stored and accessed in R. Then, we will look at how to load your data into R using built-in functions and useful packages, in order to easily import data from Excel worksheets. We will also show you how to transform your data using the reshape2 package to make your data ready to graph by plotting functions such as those provided by the ggplot2 package. Next, you will learn how to use flow-control statements and functions to reduce complexity, and help you program more efficiently. Lastly, we will go over some of the debugging tools available in R to help you successfully run your programs in R.

The following is a list of the topics that we will cover in this chapter:

  • Atomic vectors

  • Lists

  • Object attributes

  • Factors

  • Matrices and arrays

  • Data frames

  • Plots

  • Flow control

  • Functions

  • General programming and debugging tools

Before we begin our overview of R data structures, if you haven't already installed R, you can download the most recent version from http://cran.r-project.org. R compiles and runs on Linux, Mac, and Windows so that you can download the precompiled binaries to install it on your computer. For example, go to http://cran.r-project.org, click on Download R for Linux, and then click on ubuntu to get the most up-to-date instructions to install R on Ubuntu. To install R on Windows, click on Download R for Windows, and then click on base for the download link and installation instructions. For Mac OS users, click on Download R for (Mac) OS X for the download links and installation instructions.

In addition to the most recent version of R, you may also want to download RStudio, which is an integrated development environment that provides a powerful user interface that makes learning R easier and fun. The main limitation of RStudio is that it has difficulty loading very large datasets. So if you are working with very large tables, you may want to run your analysis in R directly. That being said, RStudio is great to visualize the objects you stored in your workplace at the click of a button. You can easily search help pages and packages by clicking on the appropriate tabs. Essentially, RStudio provides all that you need to help analyze your data at your fingertips. The following screenshot is an example of the RStudio user interface running the code from this chapter:

You can download RStudio for all platforms at http://www.rstudio.com/products/rstudio/download/.

Finally, the font conventions used in this book are as follows. The code you should directly type into R is preceded by > and any lines preceded by # will be treated as comment in R.

> The user will type this into R
This is the response from R
> # If the user types this, R will treat it as a comment

Note

Note that all the code written in this book was run with R Version 3.0.2.