

To create and render a chart, we'll need to create a Highcharts.Chart instance and provide it with some options.
There are a few things that we need to do before we get started:
Install
bower(http://bower.io), a package manager for JavaScript.Create a
bower.jsonfile that lists information about our project, most importantly, its dependencies, as shown in the following code:{ "name": "my-project", "dependencies": { "highcharts": "~3.0", "jquery": "^1.9" } }Tip
Downloading the example code
You can download the example code files for all Packt books you have purchased from your account at http://www.packtpub.com. If you purchased this book elsewhere, you can visit http://www.packtpub.com/support and register to have the files e-mailed directly to you.
From the same folder, run
bower installto install our dependencies.Create a simple HTML page where we will create our chart, as shown in the following code:
<html>
    <head>
        <style type='text/css'>
            #container {
                width: 300px;
                height: 300px;
                border: 1px solid #000;
                padding: 20px;
                margin: 10px;
            }
        </style>
    </head>
    <body>
        <div id='container'></div>


        <script src='./bower_components/jquery/jquery.js'></script>
        <script src='./bower_components/highcharts/highcharts-all.js'></script>

        <script type='text/javascript'>
            $(document).ready(function() {
                // our code will go here
            });
        </script>
    </body>
</html>
To get started, follow the ensuing instructions:
First, we create an
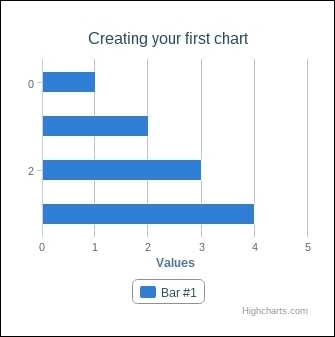
optionsobject that will define what our chart looks like, as shown in the following code:var options = { chart: { type: 'bar' }, title: { text: 'Creating your first chart' }, series: [{ name: 'Bar #1' data: [1, 2, 3, 4] }] }Next, we render our new chart by calling the
.highchartsjQuery function on some element on the page. In this case, we select an element on the page with anidvalue equal tocontainer, as shown in the following code:var options = { chart: { type: 'bar' }, title: { text: 'Creating your first chart' }, series: [{ name: 'Bar #1', data: [1,2,3,4] }] }; $('#container').highcharts(options);The following is the rendered chart:
The .highcharts function is actually a part of a jQuery plugin used to create the Highcharts.Chart objects. It uses jQuery's element selector (for example, $('#container')) to find the element we want to render the chart to and renders the chart inside that element. Even if we supply a more general selector (for example, $('div')), it will only render the first element.
As previously mentioned, it is not necessary to use jQuery to render a chart. We can create a chart instance manually using the chart.renderTo option and the Highcharts.Chart constructor. Using this method, we can either pass in the ID of an element or a reference to an element, as shown in the following code:
    // Using an element id
    var options = {
        chart: {
            renderTo: 'container'
        },
         // ...
    }

    var chart = new Highcharts.Chart(options);

    // Using an element reference
    var otherOptions = {
        chart: {
            renderTo: document.getElementById('container');
        },
         // ...
    }

    var otherChart = new Highcharts.Chart(options);