
With all the systems ready to launch, let's start our first commands. R will take both the strings in the quotes or simple numbers. Here, we will put one command as a string and one command as a number. The output is the same as the input:
> "Let's Go Sioux!"
[1] "Let's Go Sioux!"

> 15
[1] 15
R can also act as a calculator:
> ((22+5)/9)*2
[1] 6
Where R starts to shine is in the creation of vectors. Here, we will put the first ten numbers of the Fibonacci sequence in a vector using the c() function, which stands for combining the values to a vector or list (concatenate):
> c(0,1,1,2,3,5,8,13,21,34) #Fibonacci sequence
 [1]  0  1  1  2  3  5  8 13 21 34
Note that in this syntax, I included a comment, Fibonacci sequence. In R, anything after the # key on the command line is not executed.
Now, let's create an object that contains these numbers of the sequence. You can assign any vector or list to an object. In most of the R code, you will see the assign symbol as <-, which is read as gets. Instead, I will use the = (equals) symbol. This may be computer science heresy, but I have not heard a convincing argument to dissuade me from my use of =. Here, we will create an object, x, of the Fibonacci sequence:
> x = c(0,1,1,2,3,5,8,13,21,34)
To see the contents of the x object, just type it in the command prompt:
> x
 [1]  0  1  1  2  3  5  8 13 21 34
You can select subsets of a vector using brackets after an object. This will get you the first three observations of the sequence:
> x[1:3]
[1] 0 1 1
One can use a negative sign in the bracketed numbers in order to exclude the observations:
> x[-5:-6]
[1]  0  1  1  2  8 13 21 34
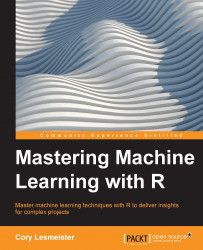
To visualize this sequence, we will utilize the plot() function:
> plot(x)
The output of the preceding command is as follows:
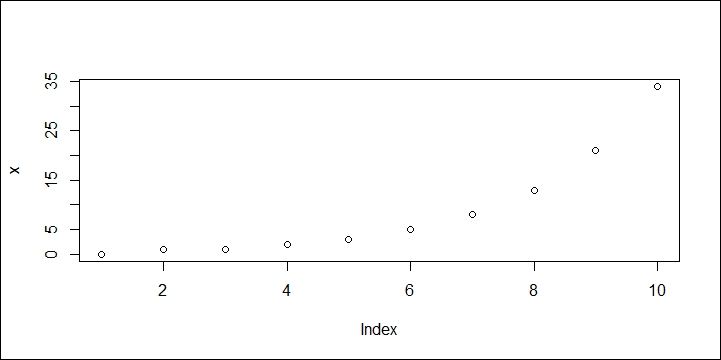
Adding a title and axis labels to the plot is easy using main=…, xlab=…, and ylab=…:
> plot(x, main="Fibonacci Sequence", xlab="Order", ylab="Value")
The output of the preceding command is as follows:
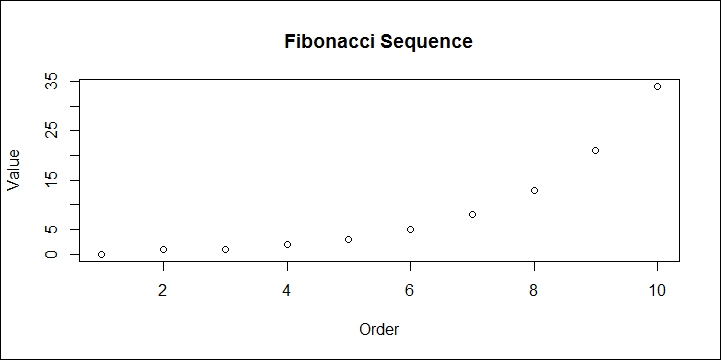
We can transform a vector in R with a plethora of functions. Here, we will create a new object, y, that is the square root of x:
> y = sqrt(x)

> y
[1] 0.000000 1.000000 1.000000 1.414214 1.732051 2.236068  2.828427
[8] 3.605551 4.582576 5.830952
It is important here to point out that if you are unsure of what syntax can be used in a function, then using ? in front of it will pull up help on the topic. Try this!
> ?sqrt
This opens up help for a function. With the creation of x and y, one can produce a scatter plot:
> plot(x,y)
The following is the output of the preceding command:
Let's now look at creating another object that is a constant. Then, we will use this object as a scalar and multiply it by the x vector, creating a new vector called x2:
> z=3

> x2 = x*z

> x2
 [1]   0   3   3   6   9  15  24  39  63 102
R allows you to perform logical tests. For example, let's test if one value is less than another:
> 5 < 6
[1] TRUE

> 6 < 5
[1] FALSE
In the first instance, R returned TRUE and in the latter, FALSE. If you want to find out if a value is equal to another value, then you would use two equal symbols. Remember, the equal symbol assigns a value. Here is an example where we want to see if any of the values in the Fibonacci sequence that we created are equal to zero:
> x == 0
 [1]  TRUE FALSE FALSE FALSE FALSE FALSE FALSE FALSE FALSE FALSE
The output provides a list and we can clearly see that the first value of the x vector is indeed zero. In short, R's relational operators, <=, <, ==, >, >=, and !, stand for less than or equal, less than, equal, greater than, greater than or equal, and not equal.
A couple of functions that we should address are rep() and seq(), which are useful in creating your own vectors. For example, rep(5,3) would replicate the value 5 three times. It also works with strings:
> rep("North Dakota Hockey", times=3)
[1] "North Dakota Hockey" "North Dakota Hockey"
[3] "North Dakota Hockey"
For a demonstration of seq(), let's say that we want to create a sequence of numbers from 0 to 10 by=2. Then the code would be as follows:
> seq(0,10, by=2)
[1]  0  2  4  6  8 10