-
Book Overview & Buying
-
Table Of Contents

R for Data Science
By :
R for Data Science
By:
Overview of this book
If you are a data analyst who has a firm grip on some advanced data analysis techniques and wants to learn how to leverage the features of R, this is the book for you. You should have some basic knowledge of the R language and should know about some data science topics.
Table of Contents (14 chapters)
Preface

 Free Chapter
1. Data Mining Patterns
2. Data Mining Sequences
3. Text Mining
4. Data Analysis – Regression Analysis
5. Data Analysis – Correlation
6. Data Analysis – Clustering
7. Data Visualization – R Graphics
8. Data Visualization – Plotting
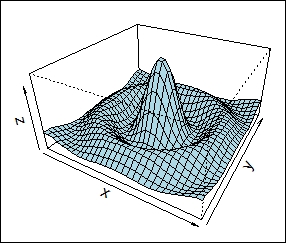
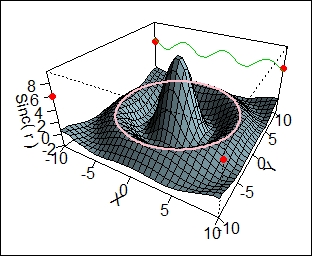
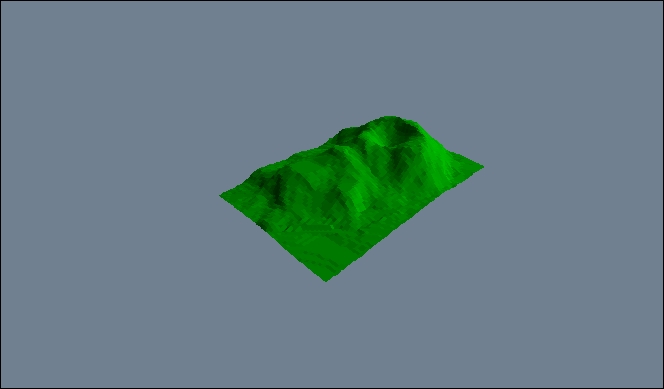
9. Data Visualization – 3D
10. Machine Learning in Action
11. Predicting Events with Machine Learning
12. Supervised and Unsupervised Learning
Index