

Tableau is a very versatile tool and is being used across various industries, businesses, and organizations. These include government and non-profit organizations, the BFSI sector, consulting, construction, education, healthcare, manufacturing, retail, FMCG, software and technology, telecommunications, and many more. The good thing about Tableau is that it is industry- and business-vertical-agnostic, and hence, as long as we have data, we can analyze and visualize it.
Tableau can connect to a wide variety of data sources, and many of the data sources are implemented as native connections in Tableau. This ensures that the connections are as robust as possible.
Note
To view the comprehensive list of data sources that Tableau connects to, we can visit the technical specification page on the Tableau website by clicking on http://www.tableau.com/products/techspecs.
Tableau provides some sample datasets with the Desktop edition. In this book, we will frequently use the sample datasets that have been provided by Tableau. We can find these datasets in the Datasources folder within the My Tableau Repository folder, which gets created in the Documents folder when Tableau Desktop is installed on the machine. We can look for these data sources in the repository or quickly download them from https://1drv.ms/f/s!Av5QCoyLTBpnhj06IKTNX0S9hK48. Once you do this, you save them in a new folder called Tableau Cookbook data that you'll find by navigating to Documents\My Tableau Repository\Datasources.
There are three files that have been uploaded, and these are the ones that we will primarily use throughout the book. They are as follows:
Microsoft Excel data called
Sample - Superstore.xlsMicrosoft Access data called
Sample - Coffee Chain.mdbMicrosoft Excel data called
Sample - CoffeeChain (Use instead of MS Access).xlsx
In the following section, we will see how to connect to the sample data source. We will be connecting to the Excel data called Sample - Superstore.xls.
This Excel file contains transactional data for a retail store. There are three worksheets in this Excel workbook. The first sheet, called the Orders sheet, contains the transaction details, The Returns sheet contains the status of returned orders. And the People sheet contains the region names and the names of the managers associated with those regions. Refer to the following image to get a glimpse of how the Excel data is structured:
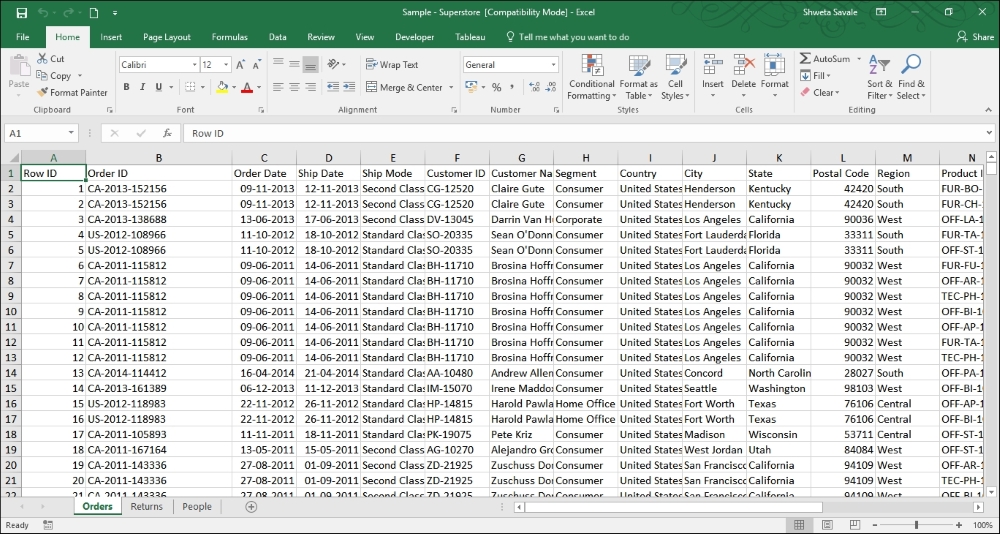
Now that we have looked at the Excel data, let's see how to connect to this data in the following recipe. To begin with, we will work on the Orders sheet of the Sample - Superstore.xls data. This worksheet contains the order details in terms of the products purchased, the name of the customer, sales, profits, discounts offered, day of purchase, and the order shipment date, among many other transactional details.
Open Tableau Desktop by double-clicking on the Tableau 10.1 icon on the desktop. You can also right-click on the icon and select Open. When you do this, you will see the Start page of Tableau, as shown in following image:

Select the Excel option from under the Connect header on the left-hand side of the screen.
Once you do this, browse the Excel file called
Sample - Superstore.xls, which is saved inTableau Cookbook dataunderDocuments|My Tableau Repository|Datasources.Once we are able to establish a connection to the referred Excel file, we will get a view as shown in the following image:

The number 1 in the preceding image refers to the data that we have connected to, and 2 refers to the list of worksheets/tables/views in our data.
Let's double-click on the Orders sheet or drag and drop the Orders sheet from the left-hand side section of the screen into a blank space that says Drag sheets here. Refer to the number 3 in the preceding image.
Once we select the Orders sheet, we will get to see the preview of our data, highlighted using the number 1 in the following image. We will see the column headers, their data type (
#,Abc, and so on), and the individual rows of data:
While connecting to a data source, we can also read data from multiple tables/sheets from that data source. However, this is something that we will explore a little later. Moving on, we will need to specify what type of connection we wish to maintain with the data source. Do we wish to connect to our data directly and maintain a Live connectivity with it or do we wish to import the data into Tableau's data engine by creating an Extract? Refer to the number 2 in the preceding image. We will understand these options in detail in the next section. However, to begin with, we will select the Live option.
Next, to get to our Tableau workspace, where we can start building our visualizations, click on the Go to Worksheet option and then Sheet 1, which we will find at the bottom left-hand side corner. Refer to the number 3 in the preceding image.
This is how we can connect to the data in Tableau. If we have a database to connect to, then we can select the relevant data source from the list and fill in the necessary information in terms of the server name, username, password, and so on. Refer to the following image to see what options we get when we connect to the Microsoft SQL Server:

Before we connect to any data, we need to make sure that our data is clean and in the right format. The Excel file that we connected to was stored in a tabular format where the first row of the sheet contained all the column headers and every other row is basically a single transaction in the data. This is the ideal data structure for making the best use of Tableau. Typically, when we connect to databases, we get a columnar/tabular type of data. However, flat files, such as Excel, can have data even in cross-tab formats. Although Tableau can read cross-tab data, we may end up facing some limitations in terms of creating certain chart types, thereby aggregating and slicing and dicing our data in Tableau.
Having said that, there may be situations where we have to deal with such cross-tab or preformatted Excel files. These files will essentially need cleaning up before being pulled into Tableau. Refer to http://kb.tableausoftware.com/articles/knowledgebase/preparing-excel-files-analysis to understand more about how we can clean up these files and make them Tableau-ready. Refer to the following article to quickly understand how we can quickly pivot the data in Excel. http://kb.tableau.com/articles/knowledgebase/addin-reshaping-data-excel.
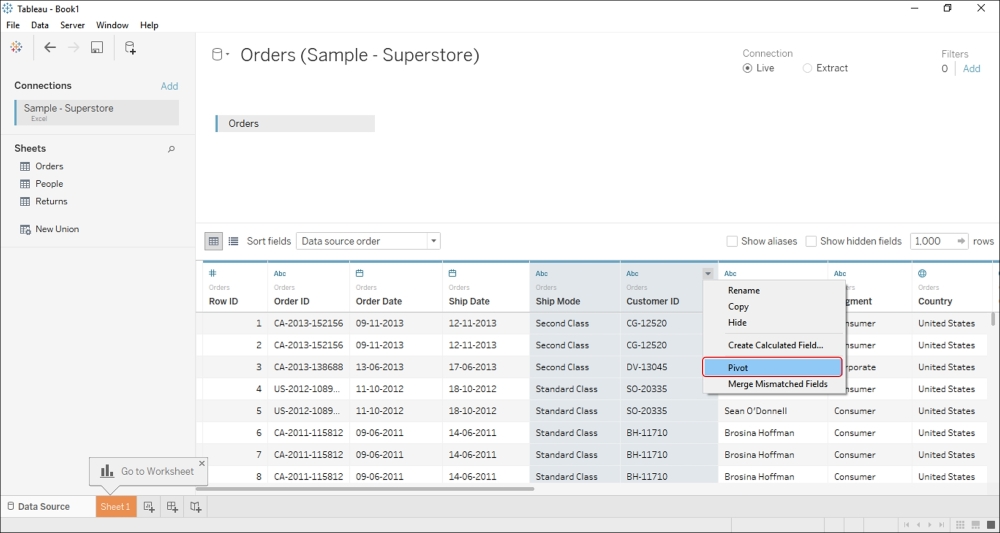
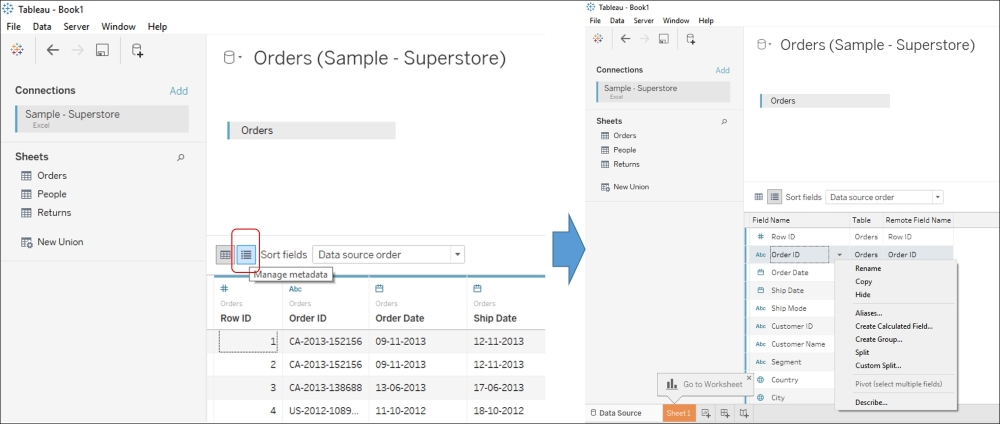
If it is a cross-tab file, then we will have to pivot it into normalized columns either at the data level or at the Tableau level on the fly. We can do so by selecting multiple columns that we wish to pivot and then selecting the Pivot option from the drop-down menu that appears when we hover over any of the columns. Refer to the following image:
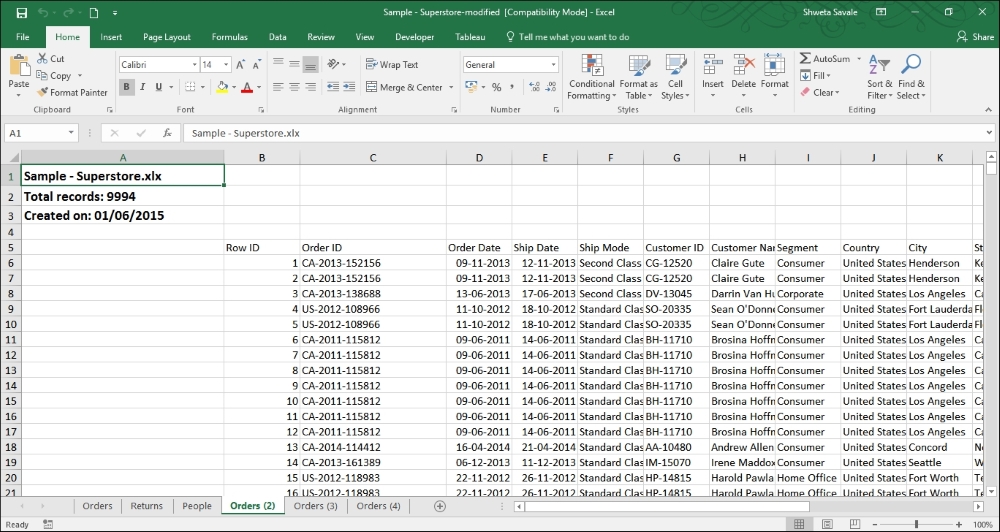
Further, if the format of the data in our Excel file is not suitable for analysis in Tableau, then we can turn on the Data Interpreter option, which becomes available when Tableau detects any unique formatting or any extra information in our Excel file. For example, the Excel data may include some empty rows and columns or extra headers and footers. Refer to the following image:
Data Interpreter can remove that extra bit of information to help prepare our Tableau data source for analysis. Refer to the following image:
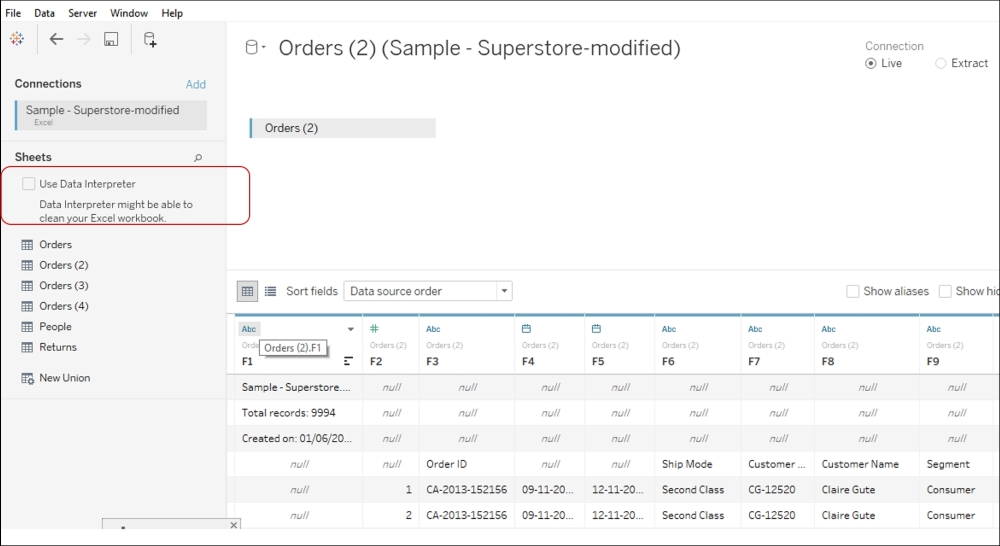
When we enable Data Interpreter, the preceding view will change to what is shown in the following image:
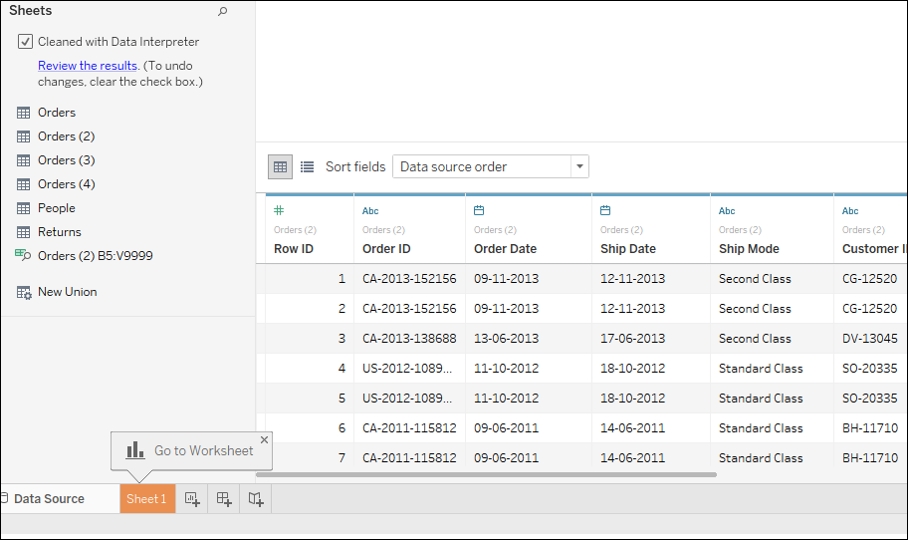
This is how Data Interpreter works in Tableau.
Now, many a times, there may also be situations where our data fields are compounded or clubbed in a single column. Refer to the following image:
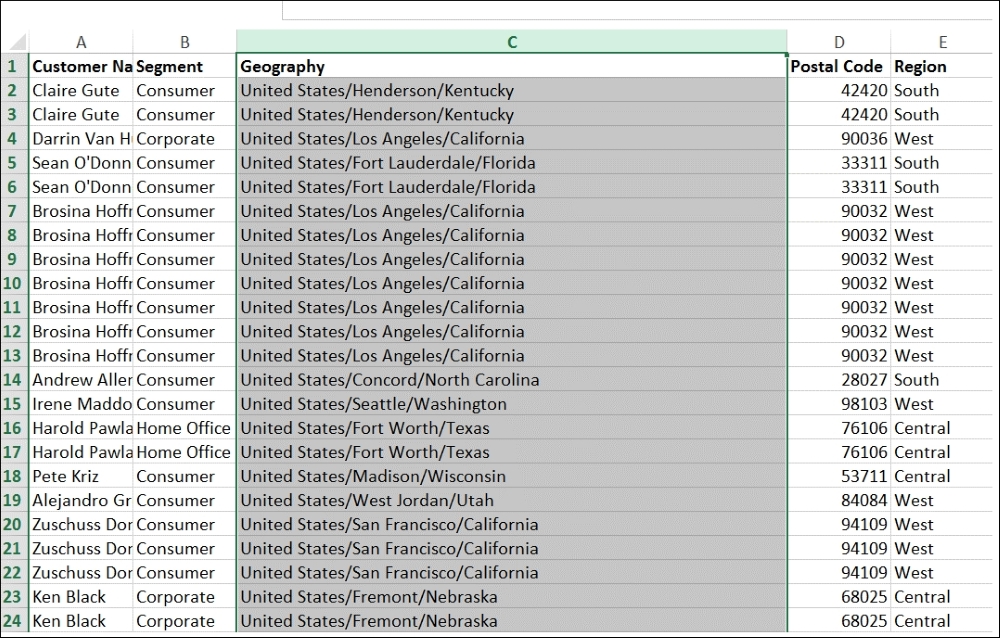
In the preceding image, the highlighted column is basically a concatenated field that has the Country, City, and State fields. For our analysis, we may want to break these and analyze each geographic level separately. To do so, we simply need to use the Split or Custom Split option in Tableau. Refer to the following image:
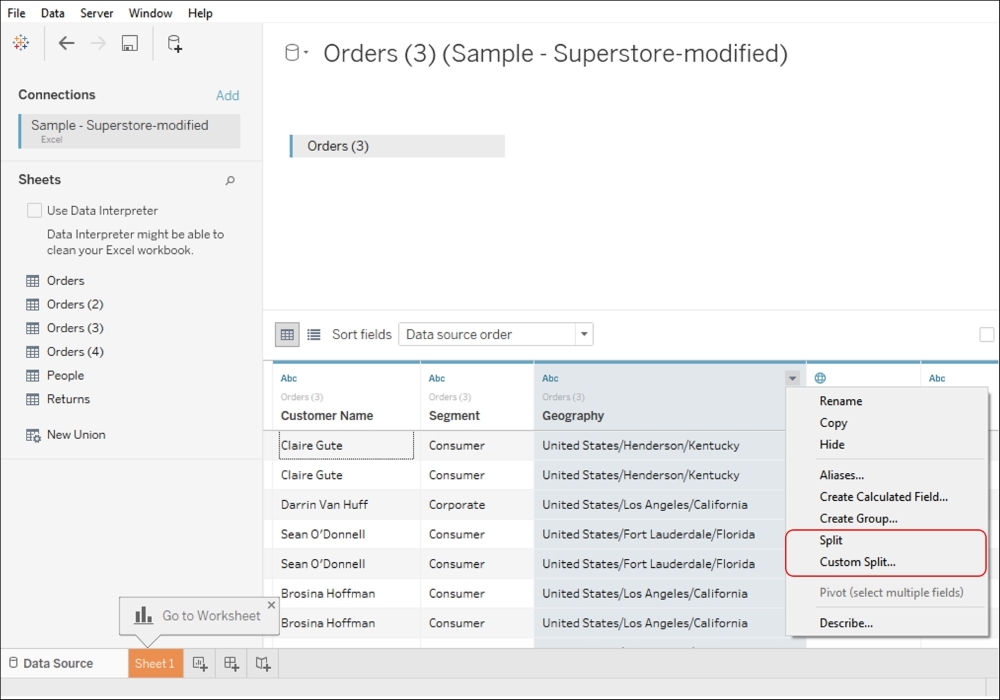
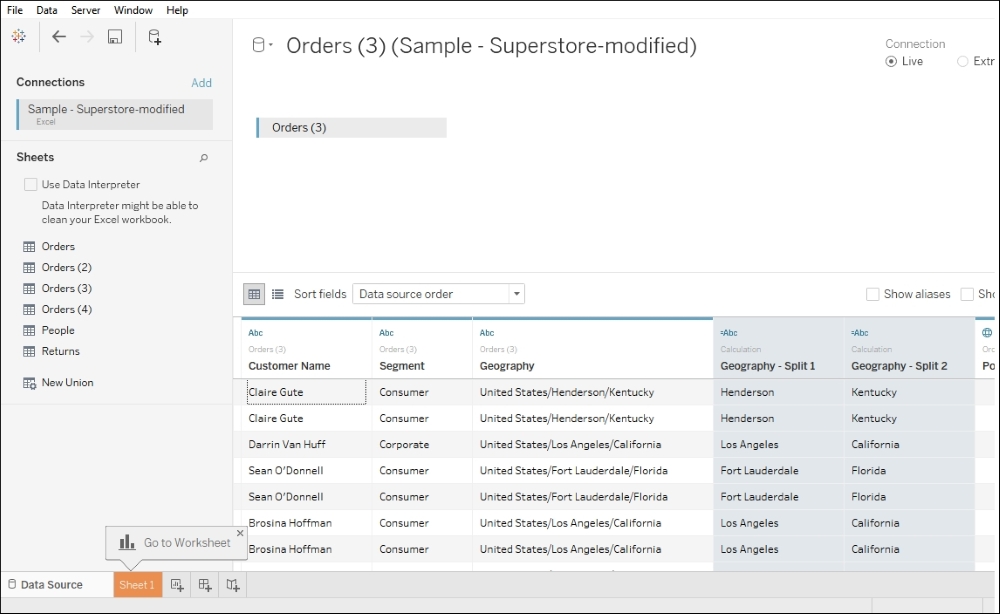
Once we do this, our view would be as shown in the following image:
Further, when preparing some data for analysis, at times a list of fields may be easy to consume as against the current preview of our data. The Metadata grid in Tableau allows us to do the same along with many other quick functions such as renaming fields, hiding columns, changing data types, changing aliases, creating calculations, splitting fields, merging fields, and pivoting the data. Refer to the following image:
After having established the initial connectivity by pointing to the right data source, we need to specify how we wish to maintain that connectivity. We can choose between the Live option and the Extract option.
The Live option helps us connect to our data directly and maintains a live connection with the data source. Using this option allows Tableau to leverage the capabilities of our data source, and in this case, the speed of our data source will determine the performance of our analysis.
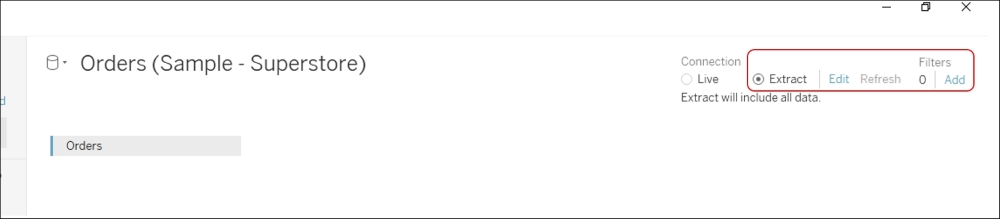
The Extract option, on the other hand, helps us import the entire data source into Tableau's fast data engine as an extract. This option basically creates a .tde file, which stands for Tableau Data Extract. In case you wish to extract only a subset of your data, then you can select the Edit option, as highlighted in following image. The Add link in the right-hand side corner helps us add filters while fetching the data into Tableau:
One point to remember about Extract is that it is a snapshot of our data stored in a Tableau proprietary format, and as opposed to a Live connection, the changes in the original data won't be reflected in the dashboard unless and until the Extract is updated.
Tip
Note that we will have to decide between Live and Extract on a case-to-case basis. Refer to http://www.tableausoftware.com/learn/whitepapers/memory-or-live-data for more clarity.