
I've observed the following scenario frequently. A new Tableau author creates a worksheet and drags a measure to the Text shelf. They would like to create another row to display a second measure but do not know how. They drag the second measure to various places on the view and get results that seem entirely unpredictable. The experience is very frustrating for the author, since it's so easy to accomplish this in Excel! The good news is that it's also easy to accomplish in Tableau. It just requires a different approach. Let's explore the solution via an exercise.
Measure Names and Measure Values are generated fields in Tableau. They do not exist in the underlying data, but they are indispensable for creating many kinds of views. As may be guessed from its placement in the Data pane and its name, Measure Names is a dimension whose members are made up of the names of each measure in the underlying dataset. Measure Values contains the numbers or values of each measure in the dataset. Watch what happens below when measure names and measure values are used independently. Afterward observe how they work elegantly together to create a view.
In the workbook associated with this chapter, navigate to the worksheet entitled
Measure Names/Values.Drag Measure Values to the Text shelf and observe the results:

Clear the worksheet by clicking on the Clear Sheet icon on the toolbar:

Drag Measure Names to the Rows shelf and observe that the view merely displays No Measure Value.
Drag Measure Values to the Text shelf. Note the list of measures and associated values.
Perhaps the interrelationship between Measure Names and Measure Values is best explained by an analogy. Consider several pairs of socks and a partitioned sock drawer. Step 2 is the equivalent of throwing the socks into a pile. The results are, well, disorganized. Step 4 is the equivalent of an empty sock drawer with partitions. The partitions are all in place but where are the socks? Step 5 is a partitioned drawer full of nicely organized socks. Measure Names is like the partitioned sock drawer. Measure Values is like the socks. Independent of one another they are not of much use. Used together, they can be applied in many different ways.
Tableau provides various shortcuts to quickly create a desired visualization. If you are new to the software, this shortcut behavior may not seem intuitive, but with a little practice and a few pointers, you will quickly gain understanding. Let's use the following exercise to explore how you can use a shortcut to rapidly deploy Measure Names and Measure Values.
In the workbook associated with this chapter, navigate to the worksheet entitled
MeasureNames/Values ShrtCts.Drag Sales directly on top of the Profit number in the view:

Observe the results, including the appearance of the Measure Values shelf, the deployment of Measure Names on the Rows and Filters shelves, and Measure Values on the Text shelf:
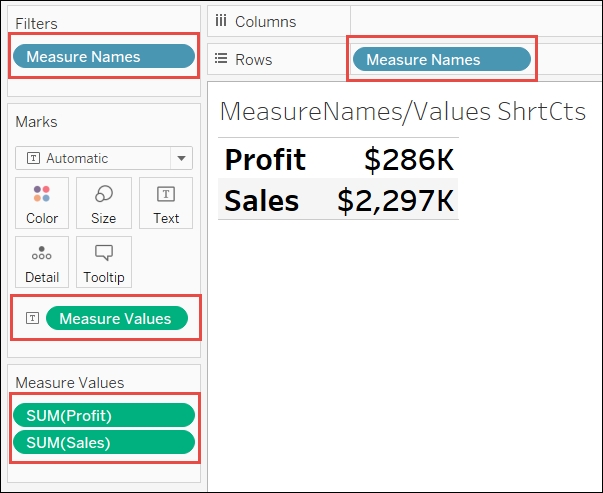
Several things happened in step 2. After placing Sales on top of the Profit number in the view, Tableau did the following:
Deployed Measure Names on the Filters shelf:
Open the Measure Names filter and observe that only Profit and Sales are selected. This limits the view to display only those two measures.
Deployed Measure Names on the Rows shelf:
Measure Names is acting like a partitioned container; that is, like the sock drawer in the preceding analogy. Because of the filter, the only rows that are displayed are for Profit and Sales.
Displayed the Measure Values shelf:
The Measure Values shelf is somewhat redundant. Although it clearly shows the measures that are displayed in the view, it essentially acts as an easy way to access the filter. You can simply drag measures on and off the Measure Values shelf to adjust the filter and thus display/hide additional Measure Values. You can also change the order within the Measure Values shelf to change the order of the measures in the view.
Deployed Measure Values on the Text shelf:
Measure Values simply defines the numbers that will be displayed for each row - in this case, the numbers associated with Profit and Sales.
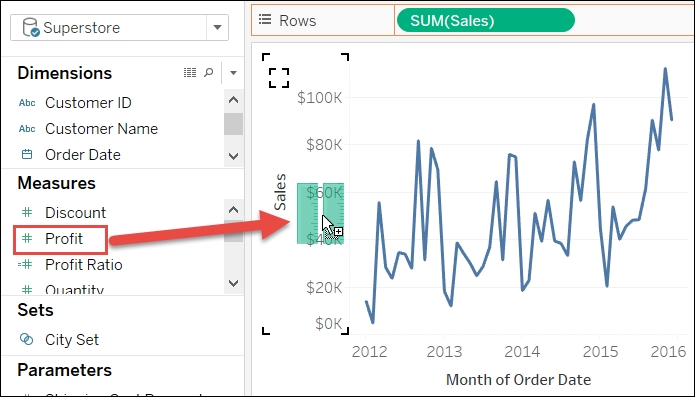
If the visualization has an axis, the shortcut to deploy Measure Names and Measure Values requires the placement of a second measure on top of the axis of an initial measure, as shown in the following screenshot: