Book Image

Mastering Elastic Stack

By : Ravi Kumar Gupta, Yuvraj Gupta
Book Image

Mastering Elastic Stack

By: Ravi Kumar Gupta, Yuvraj Gupta

Overview of this book

Even structured data is useless if it can’t help you to take strategic decisions and improve existing system. If you love to play with data, or your job requires you to process custom log formats, design a scalable analysis system, and manage logs to do real-time data analysis, this book is your one-stop solution. By combining the massively popular Elasticsearch, Logstash, Beats, and Kibana, elastic.co has advanced the end-to-end stack that delivers actionable insights in real time from almost any type of structured or unstructured data source. If your job requires you to process custom log formats, design a scalable analysis system, explore a variety of data, and manage logs, this book is your one-stop solution. You will learn how to create real-time dashboards and how to manage the life cycle of logs in detail through real-life scenarios. This book brushes up your basic knowledge on implementing the Elastic Stack and then dives deeper into complex and advanced implementations of the Elastic Stack. We’ll help you to solve data analytics challenges using the Elastic Stack and provide practical steps on centralized logging and real-time analytics with the Elastic Stack in production. You will get to grip with advanced techniques for log analysis and visualization. Newly announced features such as Beats and X-Pack are also covered in detail with examples. Toward the end, you will see how to use the Elastic stack for real-world case studies and we’ll show you some best practices and troubleshooting techniques for the Elastic Stack.
Table of Contents (19 chapters)
Mastering Elastic Stack
Credits
About the Authors
About the Reviewer
www.PacktPub.com
Customer Feedback
Preface

Exploring the discover interface


The Discover page helps you to play around with the data by easily analyzing the indexed documents. It allows you to perform different types of searches on the data, helping you to understand what the data means or how the data can be used to create visualizations. It provides the ability to choose different index names by changing the index pattern without leaving the Discover page. You can easily perform search queries, use filters, and view documents matching the queries and filters.

A Discover page interface typically looks like the following:

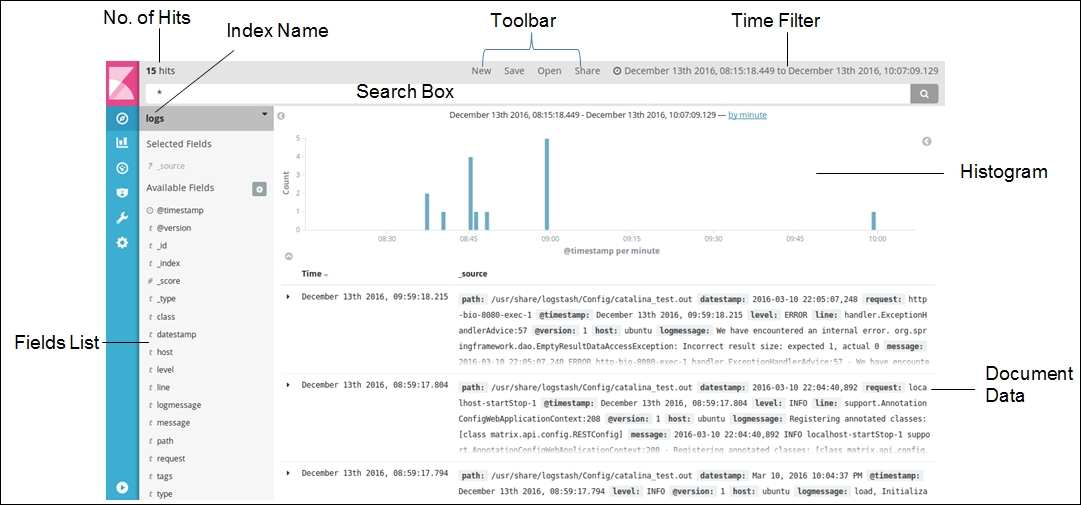
The Discover page uses the following components:

  • Time Filter: This filters the data for a specific time range

  • Search Box: This is used to search and query the data

  • Toolbar: This contains options such as new search, save search, open saved search, and share

  • Index Name: This displays the name of the selected index

  • Fields List: This displays the name of all the fields that are present within the selected index

  • Number...