
Sign In Start Free Trial
Account

Add to playlist

Create a Playlist

Modal Close icon
You need to login to use this feature.
  • Book Overview & Buying Matplotlib 2.x By Example
  • Table Of Contents Toc
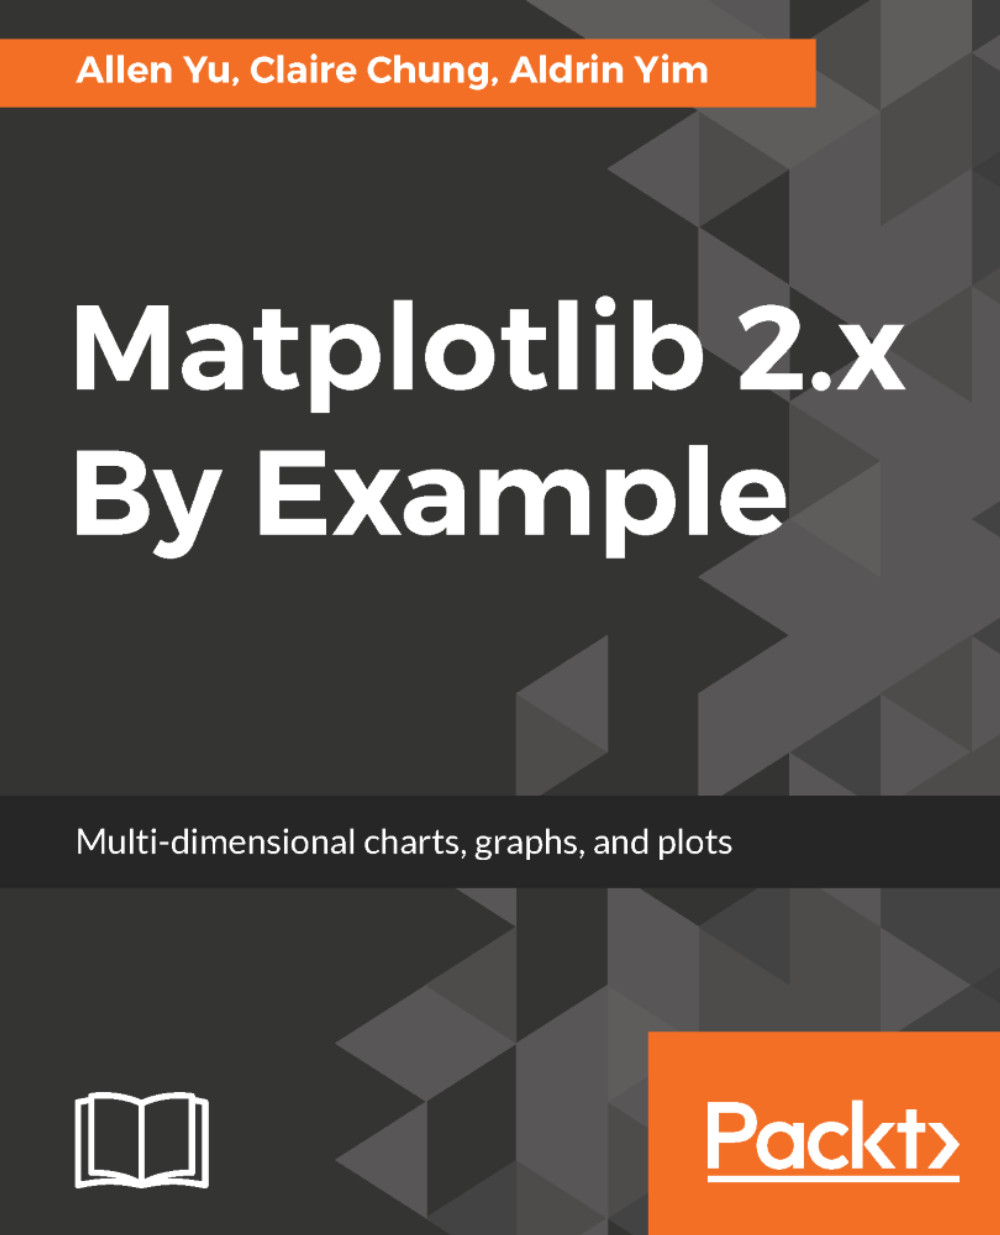
Matplotlib 2.x By Example

Matplotlib 2.x By Example

By : Allen Yu, Claire Chung, Aldrin Yim, Nikhil Borkar, Christopher Shoe
close
close
Matplotlib 2.x By Example

Matplotlib 2.x By Example

By: Allen Yu, Claire Chung, Aldrin Yim, Nikhil Borkar, Christopher Shoe

Overview of this book

Big data analytics are driving innovations in scientific research, digital marketing, policy-making and much more. Matplotlib offers simple but powerful plotting interface, versatile plot types and robust customization. Matplotlib 2.x By Example illustrates the methods and applications of various plot types through real world examples. It begins by giving readers the basic know-how on how to create and customize plots by Matplotlib. It further covers how to plot different types of economic data in the form of 2D and 3D graphs, which give insights from a deluge of data from public repositories, such as Quandl Finance. You will learn to visualize geographical data on maps and implement interactive charts. By the end of this book, you will become well versed with Matplotlib in your day-to-day work to perform advanced data visualization. This book will guide you to prepare high quality figures for manuscripts and presentations. You will learn to create intuitive info-graphics and reshaping your message crisply understandable.
Table of Contents (9 chapters)
close
close

Visualizing a bivariate distribution

We should bear in mind that the Big Mac index is not directly comparable between countries. Normally, we would expect commodities in poor countries to be cheaper than those in rich ones. To represent a fairer picture of the index, it would be better to show the relationship between Big Mac pricing and Gross Domestic Product (GDP) per capita.

We are going to acquire GDP per capita from Quandl's World Bank World Development Indicators (WWDI) dataset. Based on the previous code example of acquiring JSON data from Quandl, can you try to adapt it to download the GDP per capita dataset?

For those who are impatient, here is the full code:

import urllib
import json
import pandas as pd
import time
from urllib.request import urlopen


def get_gdp_dataset(api_key, country_code):
"""Obtain and parse a quandl GDP dataset in Pandas DataFrame...
CONTINUE READING
83
Tech Concepts
36
Programming languages
73
Tech Tools
Icon Unlimited access to the largest independent learning library in tech of over 8,000 expert-authored tech books and videos.
Icon Innovative learning tools, including AI book assistants, code context explainers, and text-to-speech.
Icon 50+ new titles added per month and exclusive early access to books as they are being written.
Matplotlib 2.x By Example
notes
bookmark Notes and Bookmarks search Search in title playlist Add to playlist download Download options font-size Font size

Change the font size

margin-width Margin width

Change margin width

day-mode Day/Sepia/Night Modes

Change background colour

Close icon Search
Country selected

Close icon Your notes and bookmarks

Confirmation

Modal Close icon
claim successful

Buy this book with your credits?

Modal Close icon
Are you sure you want to buy this book with one of your credits?
Close
YES, BUY

Submit Your Feedback

Modal Close icon
Modal Close icon
Modal Close icon