Any time series analysis has to take into account the following factors:
- Seasonality
- Trend
- Outliers and rare events
- Disruptions and step changes

 Free Chapter
Any time series analysis has to take into account the following factors:
Seasonality is a phenomenon that occurs each calendar year. The same behavior can be observed each year. A good forecasting model will be able to incorporate the effect of seasonality in its forecasts. Christmas is a great example of seasonality, where retailers have come to expect higher sales over the festive period.
Seasonality can extend into months but is usually only observed over days or weeks. When looking at time series where the periodicity is hours, you may find a seasonality effect for certain hours of the day. Some of the reasons for seasonality include holidays, climate, and changes in social habits. For example, travel companies usually run far fewer services on Christmas Day, citing a lack of demand. During most holidays people love to travel, but this lack of demand on Christmas Day could be attributed to social habits, where people tend to stay at home or have already traveled. Social habit becomes a driving factor in the seasonality of journeys undertaken on Christmas Day therefore.
It's easier for the forecaster when a particular seasonal event occurs on a fixed calendar date each year; the issue comes when some popular holidays depend on lunar movement, such as Easter, Diwali, and Eid. These holidays may occur in different weeks or months over the years, which will shift the seasonality effect. Also, if some holidays fall closer to other holiday periods, it may lead to individuals taking extended holidays and travel sales may increase more than expected in such years. The coffee shop near the office may also experience lower sales for a longer period. Changes in the weather can also impact seasonality; for example, a longer, warmer summer may be welcome in the UK, but this would impact retail sales in the autumn as most shoppers wouldn't need to buy a new wardrobe. In hotter countries, sales of air-conditioners would increase substantially compared to the summer months' usual seasonality. Forecasters could offset this unpredictability in seasonality by building in a weather forecast variable. We will explore similar challenges in the chapters ahead.
Seasonality shouldn't be confused with a cyclic effect. A cyclic effect is observed over a longer period of generally two years or more. The property sector is often associated with having a cyclic effect, where it has long periods of growth or slowdown before the cycle continues.
A trend is merely a long-term direction of observed behavior that is found by plotting data against a time component. A trend may indicate an increase or decrease in behavior. Trends may not even be linear, but a broad movement can be identified by analyzing plotted data.
Outliers and rare events are terminologies that are often used interchangeably by businesses. These concepts can have a big impact on data, and some sort of outlier treatment is usually applied to data before it is used for modeling. It is almost impossible to predict an outlier or rare event but they do affect a trend. An example of an outlier could be a customer walking into a branch to deposit an amount that is 100 times the daily average of that branch. In this case, the forecaster wouldn't expect that trend to continue.
Disruptions and step changes are becoming more common in time series data. One reason for this is the abundance of available data and the growing ability to store and analyze it. Disruptions could include instances when a business hasn't been able to trade as normal. Flooding at the local pub may lead to reduced sales for a few days, for example. While analyzing daily sales across a pub chain, an analyst may have to make note of a disruptive event and its impact on the chain's revenue. Step changes are also more common now due to technological shifts, mergers and acquisitions, and business process re-engineering. When two companies announce a merger, they often try to sync their data. They might have been selling x and y quantities individually, but after the merger will expect to sell x + y + c (where c is the positive or negative effect of the merger). Over time, when someone plots sales data in this case, they will probably spot a step change in sales that happened around the time of the merger, as shown in the following screenshot:
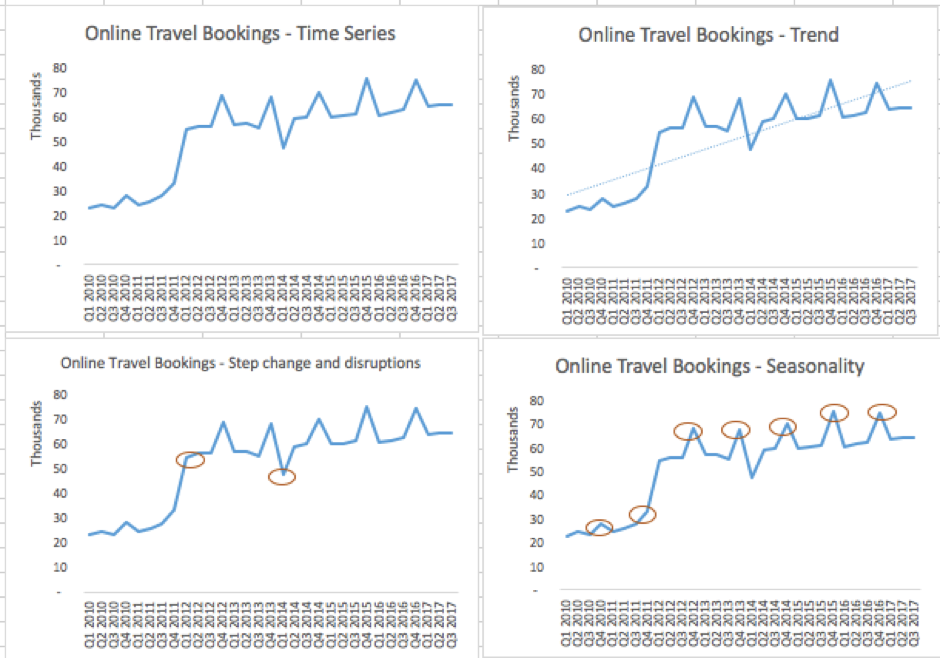
In the trend graph, we can see that online travel bookings are increasing. In the step change and disruptions chart, we can see that Q1 of 2012 saw a substantive increase in bookings, where Q1 of 2014 saw a substantive dip. The increase was due to the merger of two companies that took place in Q1 of 2012. The decrease in Q1 of 2014 was attributed to prolonged snow storms in Europe and the ash cloud disruption from volcanic activity over Iceland. While online bookings kept increasing after the step change, the disruption caused by the snow storm and ash cloud only had an effect on sales in Q1 of 2014. In this case, the modeler will have to treat the merger and the disruption differently while using them in the forecast, as disruption could be disregarded as an outlier and treated accordingly. Also note that the seasonality chart shows that Q4 of each year sees almost a 20% increase in travel bookings, and this pattern continues each calendar year.