


-
Book Overview & Buying
-
Table Of Contents

Python for Algorithmic Trading Cookbook - Second Edition
By :


Python for Algorithmic Trading Cookbook
By:
Overview of this book
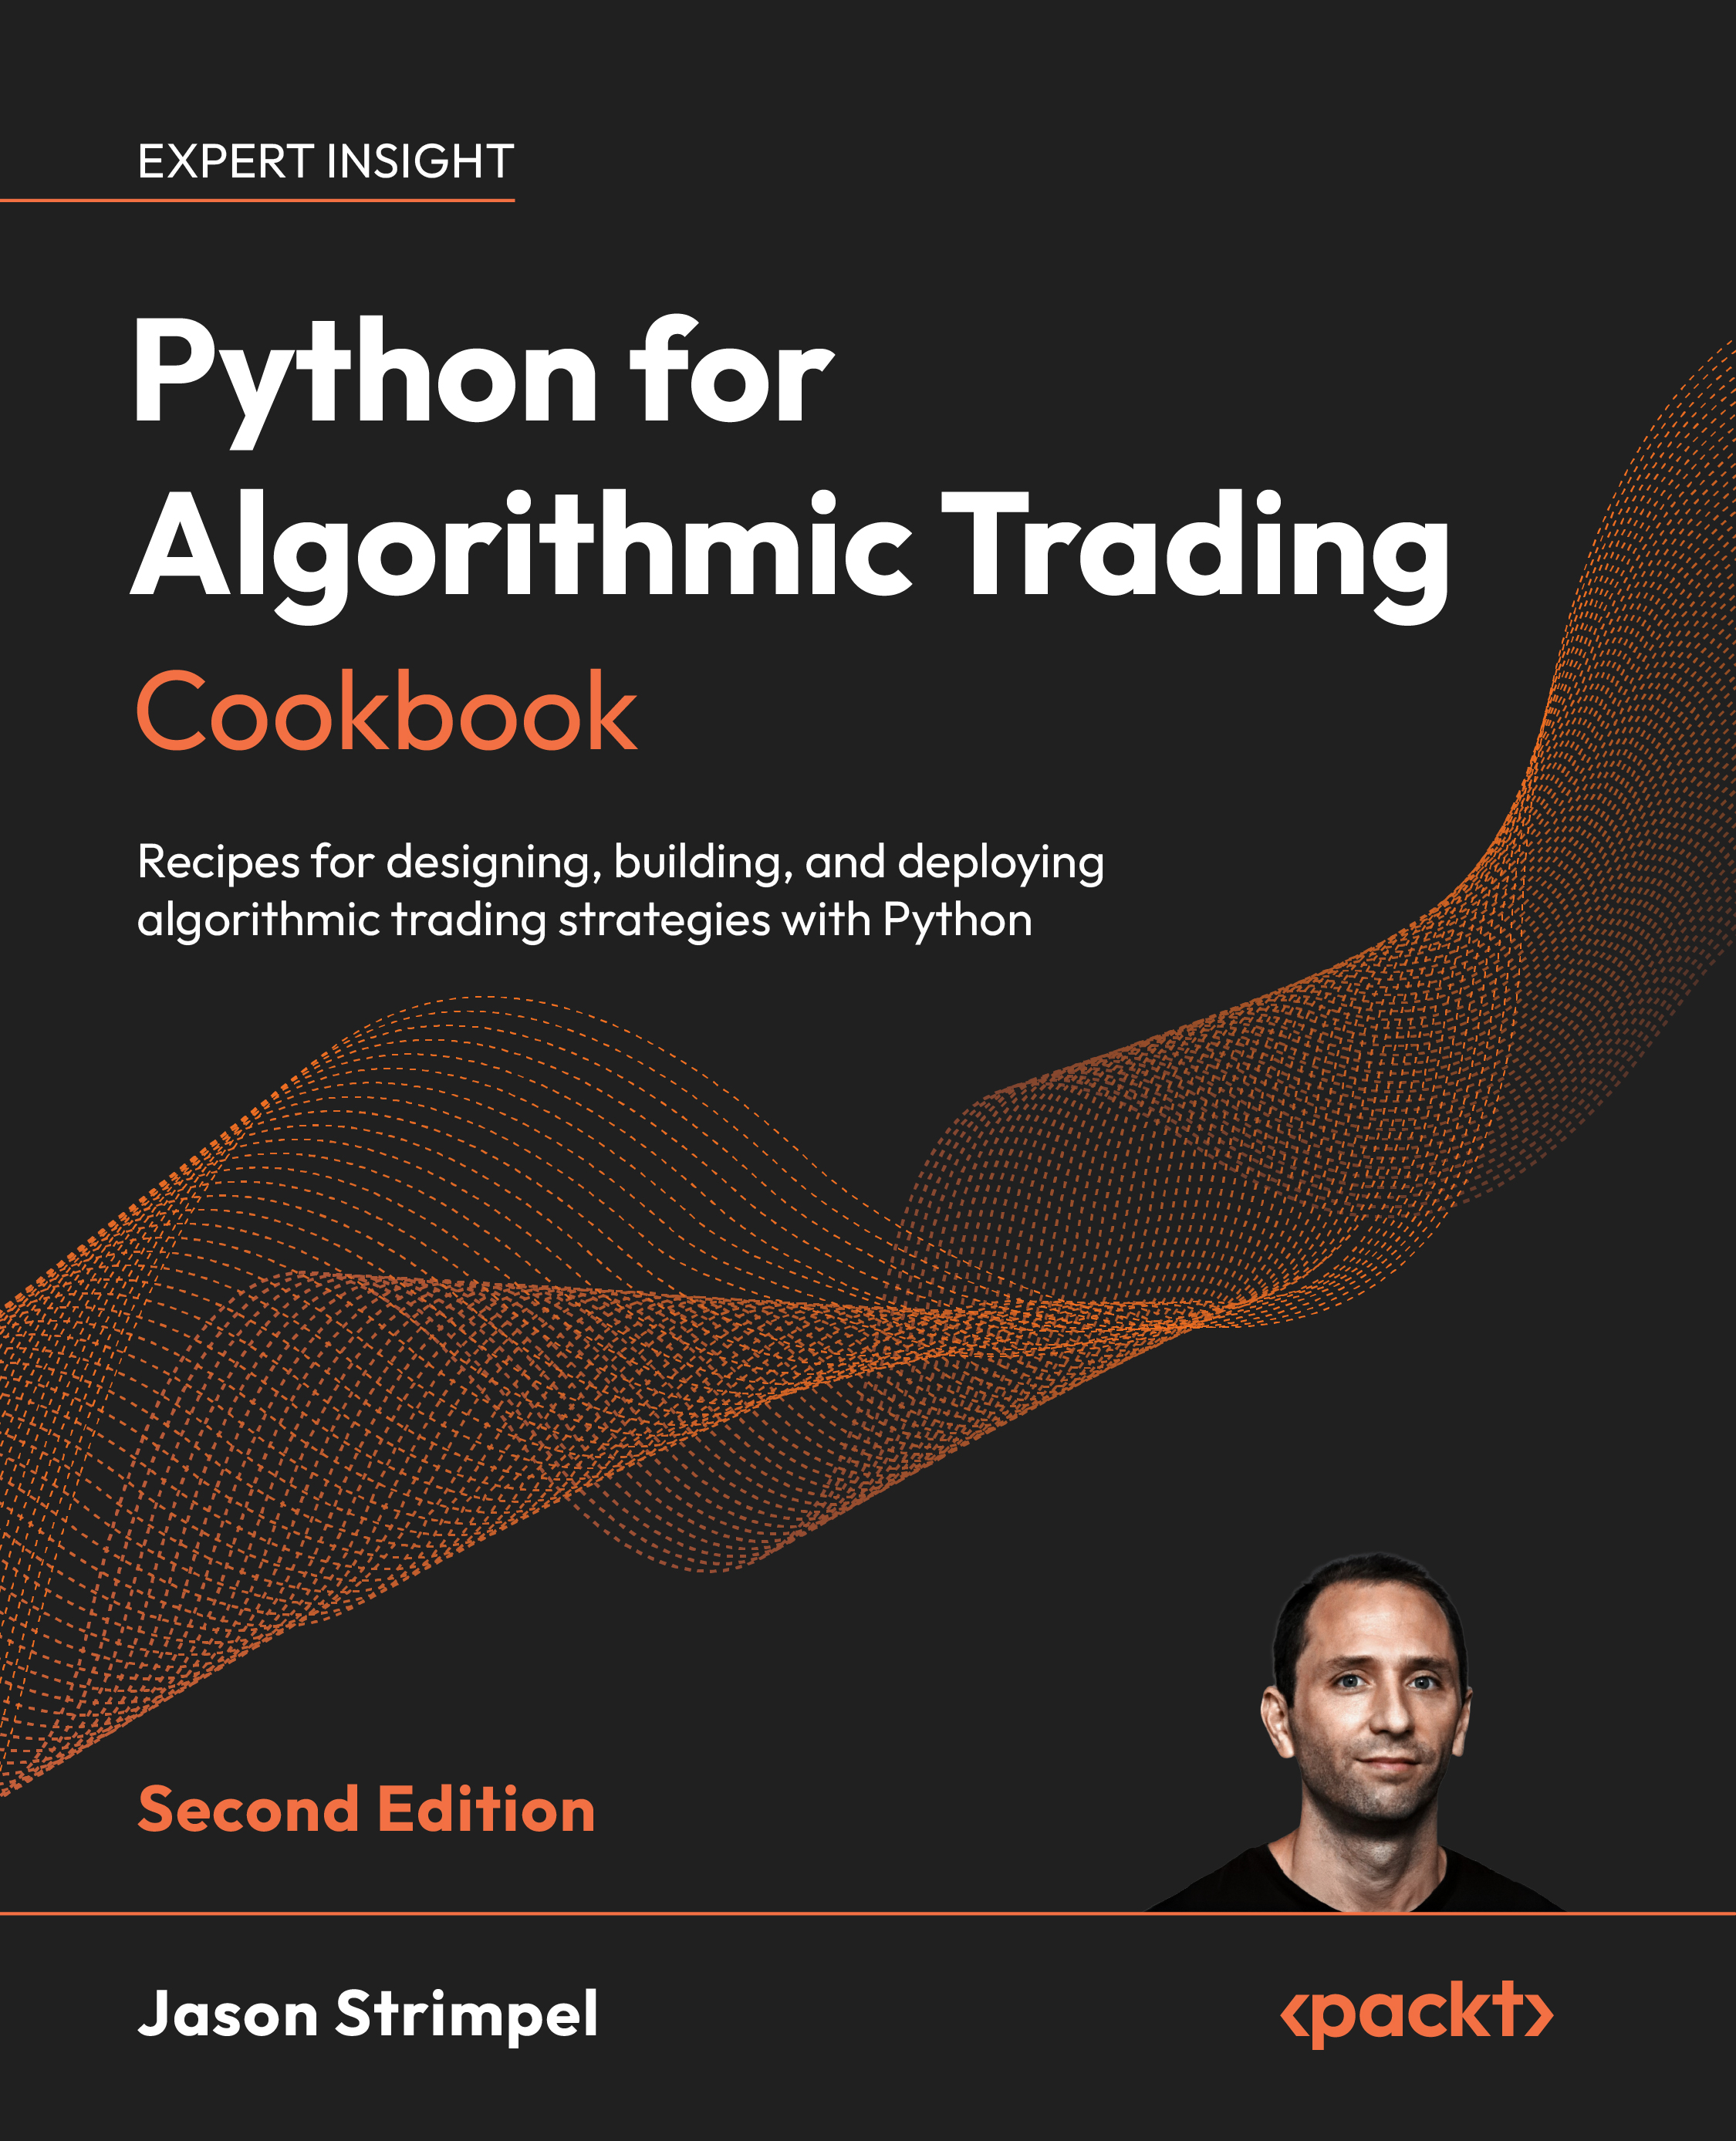
Get practical Python code for algorithmic trading from Jason Strimpel, founder of PyQuant News and a veteran of global trading, risk management, and machine learning. This hands-on guide shows you how to turn market data into tested, automated trading strategies using modern Python tools.
You’ll source equities, options, and futures data with OpenBB and FMP, then accelerate Python for data analysis workflows with Pandas, Polars, Parquet, DuckDB, and ArcticDB. You’ll visualize market data with Matplotlib, Seaborn, and Plotly Dash before moving into alpha research and quantitative trading techniques.
Detailed recipes help you engineer alpha factors with PCA, regression, Fama-French models, SciPy, and statsmodels. You’ll design and evaluate quantitative trading strategies using VectorBT, Zipline Reloaded, Alphalens Reloaded, and PyFolio, including walk-forward analysis and risk-aware performance review.
For execution, you’ll connect to the Interactive Brokers API to stream ticks, manage orders, retrieve portfolio state, and monitor live trading workflows. By the end, you’ll have reusable Python templates for researching, backtesting, evaluating, and operating algorithmic trading strategies.
Table of Contents (19 chapters)
Preface


 Free Chapter
Chapter 1: Acquire Free Financial Market Data with Cutting-Edge Python Libraries
Chapter 2: Analyze and Transform Financial Market Data with pandas
Chapter 3: Accelerate Financial Market Data Analysis with Polars and DuckDB
Chapter 4: Visualize Financial Market Data with Matplotlib, Seaborn, and Plotly Dash

Chapter 5: Build a Quantamental Research Database with Hedge Fund Tools
Chapter 6: Conduct Market Research with Advanced AI and Agentic Workflows
Chapter 7: Build Alpha Factors for Stock Portfolios
Chapter 8: Vector-Based Backtesting with VectorBT
Chapter 9: Event-Based Backtesting Factor Portfolios with Zipline Reloaded
Chapter 10: Evaluate Factor Risk and Performance with Alphalens Reloaded
Chapter 11: Assess Backtest Risk and Performance Metrics with Pyfolio
Chapter 12: Set Up the Interactive Brokers Python API
Chapter 13: Manage Orders, Positions, and Portfolios with the IB API
Chapter 14: Deploy Strategies to a Live Environment
Chapter 15: Advanced Recipes for GPU-Accelerated Trading Research
Chapter 16: Unlock Your Exclusive Benefits
Other Books You May Enjoy
Index


