

So, we have covered how to create different types of visualizations in Kibana; now, let's see how we can integrate different types of visualizations to create the dashboard. Dashboards are quite useful, as they provide us with a single view to monitor the KPI. To create a dashboard in Kibana, we need to do the following:
- Click on the Dashboard link from the left-hand menu, which will open the dashboards page with a list of the existing dashboards.
- We can click on any existing dashboard to open the dashboard. But as we want to create a new one, click on the Create new dashboard button in the top-right corner of the page.
- This will open a blank page with the message This dashboard is empty. Let’s fill it up!.
- Click on the Add button to add the visualizations; this will open Add Panels screen, as shown here:
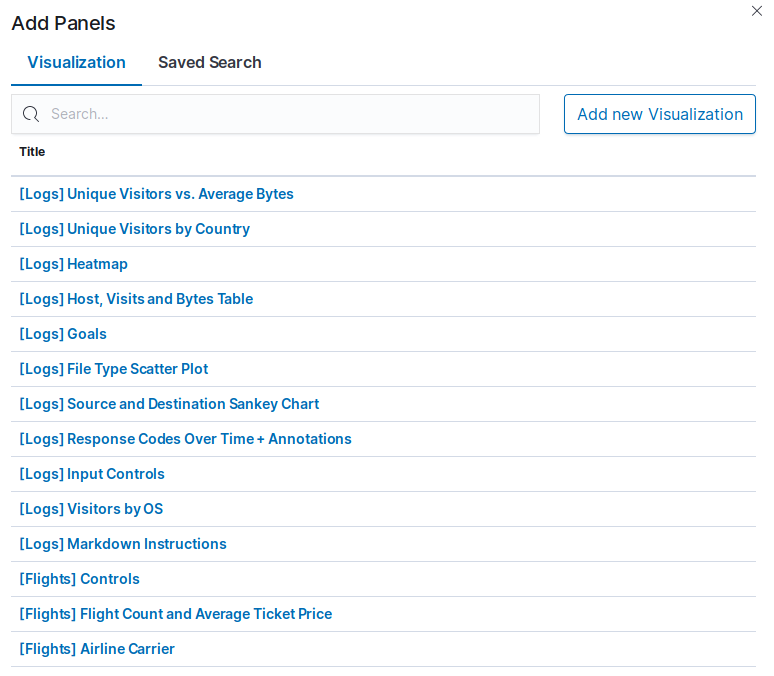
In the preceding screenshot...