
Graphs are classified into several categories, depending on the properties of the connections between nodes. These categories are important to consider when modeling your data as a graph, and even more so when you want to run algorithms on them, because the behavior of the algorithm might change and create unexpected results in some situations. Let's discover some of those properties with examples.
Directed versus undirected
So far, we've only talked about graphs as a set of connected nodes. Those connections can be different depending on whether you are going from node A to node B or vice versa. For instance, some streets can only be driven in one direction, right? Or, the fact that you are following someone on Twitter (there is a Follows relationship from you to that user) doesn’t mean that user is also following you. That’s the reason why some relationships are directed. On the contrary, a relationship of type married to is naturally undirected, if A is married to B, usually B is also married to A:

In the right-hand side graph, directed, the transition between B and A is not allowed in that direction
Weighted versus unweighted
As well as direction, relationships can also carry more information. Indeed, in a road network for instance, not all streets have the same importance in a routing system. They have different lengths or occupancy during peak hours, meaning the travel time will be very different from one street to another. The way to model this fact with graphs is to assign a weight to each edge:
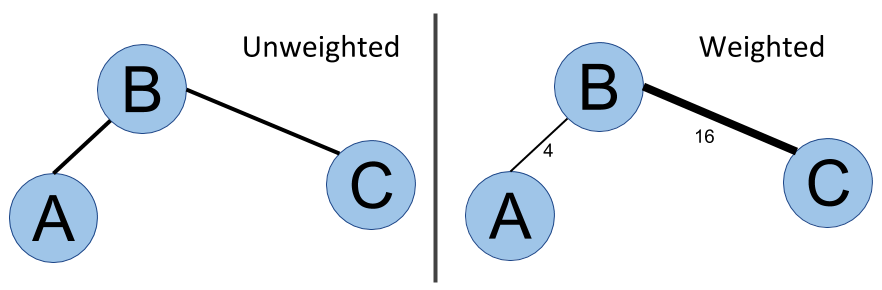
In the weighted graph, relationships have weights 16 and 4
Algorithms such as shortest path algorithms take this weight into account to compute a shortest weighted path.
This is not only important for road networks. In a computer network, the distance between units may also have its own importance in terms of connection speed. In social networks, distance is often not the most important property to quantify the strength of a relationship, but we can think of other metrics. For instance, how long have those two people been connected? Or when was the last time user A reacted to a post of user B?
Cyclic versus acyclic
A cycle is a loop. A graph is cyclic if you can find at least one path starting from one node and going back to that exact same node.
As you can imagine, it's important to be aware of the presence of cycles in a graph, since they can create infinite loops in a graph traversal algorithm, if we do not pay enough attention to it. The following image shows an acyclic graph versus a cyclic graph:

Dense versus sparse
Graph density is another property that is important to have in mind. It is related to the average number of connections for each node. In the next diagram, the left graph only has three connections for four nodes, whereas the right graph has six connections for the same amount of nodes, meaning the latter is denser than the former:

Graph traversal
But why worry about density? It is important to realize that everything within graph databases is about graph traversal, jumping from one node to another by following an edge. This can become very time-consuming with a very dense graph, especially when traversing the graph in a breadth-first way. The following image shows the graph traversals in which breadth-first search is compared to depth-first search:

Connected versus disconnected
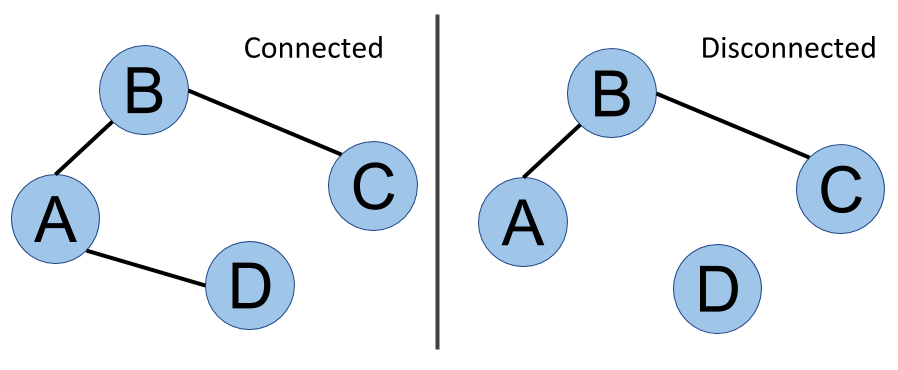
Last but not least is the notion of connectivity or a connected graph. In the next diagram, it is always possible to go from one vertex to another, whatever pair of vertices is considered. This graph is said to be connected. On the other side of the figure, you can see that D is isolated - there is no way to go from D to A, for example. This graph is disconnected, and we can even say that it has two components. We will cover the analysis of this kind of structure in Chapter 7, Community Detection and Similarity Measures. The following image shows connected versus disconnected graphs:
This is a non-exhaustive list of graph properties, but they are the main ones we will have to worry about within our graph database adventure. Some of them are important when creating the whiteboard graph model for our data, as we will discuss in the next section.