

The Unity Profiler is built into the Unity Editor itself, and provides an expedient way of narrowing our search for performance bottlenecks by generating usage and statistics reports on a multitude of Unity3D components during runtime:
CPU usage per component of the Unity3D Engine
Rendering statistics
GPU usage on several programmable pipeline steps and stages
Memory usage and statistics
Audio usage and statistics
Physics engine usage and statistics
Note
With the release of Unity 5.0, Unity Technologies has made the Profiler available to all developers running the Personal Edition (the new name for the Free Edition).
Users running the Free Edition of Unity 4 must either upgrade to Unity 5, or purchase a license for Unity 4 Pro Edition.
This additional reporting comes with a price, however. Additional instrumentation flags will be enabled within the compiler, generating runtime logging events and a different level of automated code optimization while the Profiler is in use, which causes some additional CPU and memory overhead at runtime. This profiling cost is not completely negligible, and is likely to cause inconsistent behavior when the Profiler is toggled on and off.
In addition, we should always avoid using Editor Mode for any kind of profiling and benchmarking purposes due to the overhead costs of the Editor; its interface, and additional memory consumption of various objects and components. It is always better to test our application in a standalone format, on the target device, in order to get a more accurate and realistic data sample.
Tip
Users who are already familiar with connecting the Unity Profiler to their applications should skip to the section titled The Profiler window
We will begin with a brief tutorial on how to connect our game to the Unity Profiler within a variety of contexts:
Local instances of the application, either through the Editor or standalone
Profiling the Editor itself
Remote instances of the application on an iOS device (the iPad tablet or the iPhone device)
Remote instances of the application on an Android device (a tablet or phone device running Android OS)
We will briefly cover the requirements for setting up the Profiler in each of these contexts.
The only way to access the Profiler is to launch it through the Unity Editor and connect it to a running instance of our application. This is the case whether we're running our game within the Editor, running a standalone application on the local or remote device, or when we wish to profile the Editor itself.
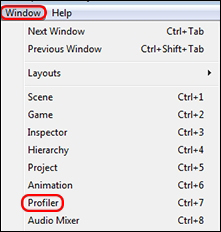
To open the Profiler, navigate to Window | Profiler within the Editor. If the Editor is already running in Play Mode, then we may see reporting data gathering in the Profiler Window:
Tip
To profile standalone projects, ensure that the Use Development Mode and Autoconnect Profiler flags are enabled when the application is built.
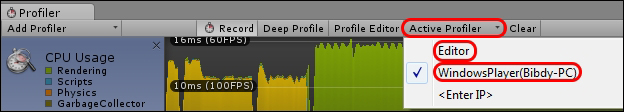
Selecting whether to profile an Editor-based instance (through the Editor's Play Mode) or a standalone instance (separately built and running in the background) can be achieved through the Active Profiler option in the Profiler window.
The Unity Profiler
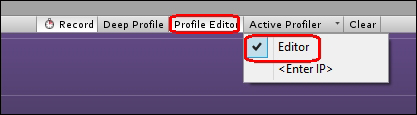
Profiling the Editor itself, such as profiling custom Editor Scripts, can be enabled with the Profile Editor option in the Profiler window as shown in the following screenshot. Note that this requires the Active Profiler option to be configured to Editor.
The Profiler can also connect to an instance of the Unity Webplayer that is currently running in a browser. This enables us to profile our web-based application in a more real-world scenario through the target browser, and test multiple browser types for inconsistencies in behavior.
Ensure that the Use Development Mode flag is enabled when the Webplayer application is built.
Launch the compiled Webplayer application in a browser and, while it is active in the browser window, hold the Alt key (Option key on a Mac) and right-click on the Webplayer object within the browser to open the Release Channel Selection menu. Then select the Development channel, as shown in the following screenshot:

As shown in the following screenshot, open the Profiler in the Unity Editor within the Profiler window, and then navigate to Active Profiler | WindowsWebPlayer(COMPUTERNAME) or Active Profiler | OSXWebPlayer(COMPUTERNAME), depending on the Operating System:

You should now see reporting data collecting in the Profiler window.
The Profiler can also be connected to an active instance of the application running remotely on an iOS device, such as an iPad or iPhone. This can be achieved through a shared WiFi connection. Follow the given steps to connect the Profiler to an Apple device:
Note
Note that remote connection to an Apple device is only possible when the Profiler is running on an Apple Mac device.
Ensure that the Use Development Mode and Autoconnect Profiler flags are enabled when the application is built.
Connect both the iOS device and Mac to a local or ADHOC WiFi network.
Attach the iOS device to the Mac via the USB or the Lightning cable.
Begin building the application with the Build & Run option as normal.
Open the Profiler window in the Unity Editor and select the device under Active Profiler.
You should now see the iOS device's profiling data gathering in the Profiler window.
There are two different methods for connecting an Android device to the Unity Profiler: either through a WiFi connection or using the Android Debug Bridge (ADB) tool. ADB is a suite of debugging tools that comes bundled with the Android SDK.
Follow the given steps for profiling over a WiFi connection:
Ensure that the Use Development Mode and Autoconnect Profiler flags are enabled when the application is built.
Connect both the Android and desktop devices to a local WiFi network.
Attach the Android device to the desktop device via the USB cable.
Begin building the application with the Build & Run option as normal.
Open the Profiler window in the Unity Editor and select the device under Active Profiler.
You should now see the Android device's profiling data gathering in the Profiler Window.
For ADB profiling, follow the given steps:
From the Windows command prompt, run the
adbdevicescommand, which checks if the device is recognized by ADB (if not, then the specific device drivers for the device may need to be installed and/or USB debugging needs to be enabled on the target device).Ensure that the Use Development Mode and Autoconnect Profiler flags are enabled when the application is built.
Attach the Android device to the desktop device via the cable (for example, USB).
Begin building the application with the Build & Run option as normal.
Open the Profiler Window in the Unity Editor and select the device under Active Profiler.
You should now see the Android device's profiling data gathering in the Profiler window.
We will now cover the essential features of the Profiler as they can be found within the interface.
Note
Note that this section covers features as they appear in the Unity Profiler within Unity 5. Additional features were added to the Profiler with the release of Unity 5; these may be different, or not exist, in Unity 4's Profiler.
The Profiler window is split into three main areas:
Controls
Timeline View
Breakdown View
These areas are as shown in the following screenshot:
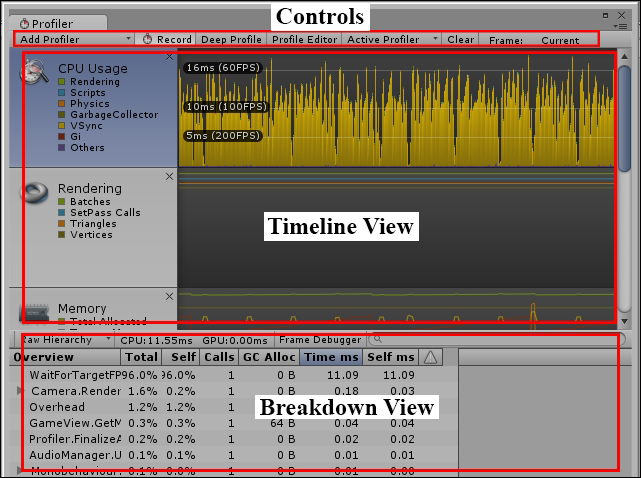
The top bar contains multiple controls we can use to affect what is being profiled and how deeply in the system data is gathered from. They are:
Add Profiler: By default, the Profiler shows several of Unity's engine components in the Timeline View, but the Add Profiler option can be used to add additional items. See the Timeline View section for a complete list of components we can profile.
Record: Enabling this option will make the Profiler continuously record profiling data. Note that data can only be recorded if Play Mode is enabled (and not paused) or if Profile Editor is enabled.
Deep Profile: Ordinary profiling will only record the time and memory allocations made by any Unity callback methods, such as
Awake(),Start(),Update(),FixedUpdate(), and so on. Enabling Deep Profile recompiles our scripts to measure each and every invoked method. This causes an even greater instrumentation cost during runtime and uses significantly more memory since data is being collected for the entire call stack at runtime. As a consequence, Deep Profiling may not even be possible in large projects running on weak hardware, as Unity may run out of memory before testing can even begin!Tip
Note that Deep Profiling requires the project to be recompiled before profiling can begin, so it is best to avoid toggling the option during runtime.
Because this option measures all methods across our codebase in a blind fashion, it should not be enabled during most of our profiling tests. This option is best reserved for when default profiling is not providing enough detail, or in small test Scenes, which are used to profile a small subset of game features.
If Deep Profiling is required for larger projects and Scenes, but the Deep Profile option is too much of a hindrance during runtime, then there are alternatives that can be found in the upcoming section titled Targeted Profiling of code segments.
Profile Editor: This option enables Editor profiling—that is, gathering profiling data for the Unity Editor itself. This is useful in order to profile any custom Editor Scripts we have developed.
Active Profiler: This drop-down globally offers choices to select the target instance of Unity we wish to profile; this, as we've learned, can be the current Editor application, a local standalone instance of our application, or an instance of our application running on a remote device.
Clear: This clears all profiling data from the Timeline View.
Frame Selection: The Frame counter shows how many frames have been profiled, and which frame is currently selected in the Timeline View. There are two buttons to move the currently selected frame forward or backward by one frame, and a third button (the Current button) that resets the selected frame to the most recent frame and keeps that position. This will cause the Breakdown View to always show the profiling data for the current frame during runtime profiling.
Timeline View: The Timeline View reveals profiling data that has been collected during runtime, organized by areas depending on which component of the engine was involved.
Each Area has multiple colored boxes for various subsections of those components. These colored boxes can be toggled to reveal/hide the corresponding data types within the Timeline View.
Each Area focuses on profiling data for a different component of the Unity engine. When an Area is selected in the Timeline View, essential information for that component will be revealed in the Breakdown View for the currently selected frame.
The Breakdown View shows very different information, depending on which Area is currently selected.
This Area shows CPU Usage for multiple Unity subsystems during runtime, such as MonoBehaviour components, cameras, some rendering and physics processes, user interfaces (including the Editor's interface, if we're running through the Editor), audio processing, the Profiler itself, and more.
There are three ways of displaying CPU Usage data in the Breakdown View:
Hierarchy
Raw Hierarchy
Timeline
The Hierarchy Mode groups similar data elements and global Unity function calls together for convenience—for instance, rendering delimiters, such as BeginGUI() and EndGUI() calls are combined together in this Mode.
The Raw Hierarchy Mode will separate global Unity function calls into individual lines. This will tend to make the Breakdown View more difficult to read, but may be helpful if we're trying to count how many times a particular global method has been invoked, or determining if one of these calls is costing more CPU/memory than expected. For example, each BeginGUI() and EndGUI() call will be separated into different entries, possibly cluttering the Breakdown View, making it difficult to read.
Perhaps, the most useful mode for the CPU Area is the Timeline Mode option (not to be confused with the main Timeline View). This Mode organizes CPU usage during the current frame by how the call stack expanded and contracted during processing. Blocks at the top of this view were directly called by the Unity Engine (such as the Start(), Awake(), or Update() methods), while blocks underneath them are methods that those methods had called, which can include methods on other Components or objects.
Meanwhile, the width of a given CPU Timeline Block gives us the relative time it took to process that method compared to other blocks around it. In addition, method calls that consume relatively little processing time, relative to the more greedy methods, are shown as gray boxes to keep them out of sight.
The design of the CPU Timeline Mode offers a very clean and organized way of determining which particular method in the call stack is consuming the most time, and how that processing time measures up against other methods being called during the same frame. This allows us to gauge which method is the biggest culprit with minimal effort.
For example, let's assume that we are looking at a performance problem in the following screenshot. We can tell, with a quick glance, that there are three methods that are causing a problem, and they each consume similar amounts of processing time, due to having similar widths.
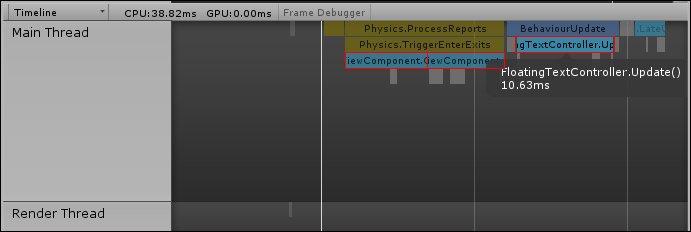
In this example, the good news is that we have three possible methods through which to find performance improvements, which means lots of opportunities to find code that can be improved. The bad news is that increasing the performance of one method will only improve about one-third of the total processing for that frame. Hence, all three methods will need to be examined and improved in order to minimize the amount of processing time during this frame.
The CPU Area will be most useful during Chapter 2, Scripting Strategies.
The GPU Area is similar to the CPU Area, except that it shows method calls and processing time as it occurs on the GPU. Relevant Unity method calls in this Area will relate to cameras, drawing, opaque and transparent geometry, lighting and shadows, and so on.
The GPU Area will be beneficial during Chapter 6, Dynamic Graphics.
The Rendering Area provides rendering statistics, such as the number of SetPass calls, the total number of Batches used to render the scene, the number of Batches saved from Dynamic and Static Batching, memory consumed for Textures, and so on.
The Rendering Area will be useful in Chapter 3, The Benefits of Batching.
The Memory Area allows us to inspect memory usage of the application in the Breakdown View in two different ways:
Simple Mode
Detailed Mode
The Simple Mode provides only a high-level overview of memory consumption of components such as Unity's low-level Engine, the Mono framework (total heap size that will be garbage-collected), Graphics, Audio (FMOD), and even memory used to store data collected by the Profiler.
The Detailed Mode shows memory consumption of individual game objects and components, for both their native and managed representations. It also has a column explaining the reason for that object consuming memory and when it might be de-allocated.
The Memory Area will be the main focal point of Chapter 7, Masterful Memory Management.
The Audio Area grants an overview of audio statistics and can be used both to measure CPU usage from the audio system, as well as total memory consumed by Audio Sources (for both playing and paused sources) and Audio Clips.
The Audio Area will come in handy as we explore art assets in Chapter 4, Kickstart Your Art.
There are two different Physics Areas, one for 3D physics (Nvidia's PhysX) and another for the 2D physics system (Box2D) that was integrated into the Unity Engine in version 4.5. This Area provides various physics statistics such as Rigidbody, Collider, and Contact counts.
We will be making use of this Area in Chapter 5, Faster Physics.