

The next step in this project is to create and set up an account on the web service Temboo, so you can use the wide range of services provided by Temboo to upload data to Google Docs and to use their Gmail and Twitter libraries. This account will actually be used in the whole book for the other projects as well.
To do so, the first step is to simply go to the Temboo website at http://temboo.com/.
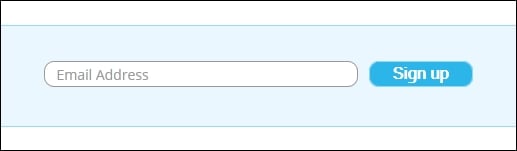
On the main page, simply enter your e-mail address to register and click on Sign up, as shown in the following screenshot:
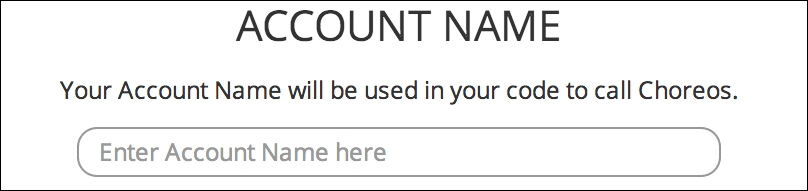
You will then be asked to enter some basic information about your account, such as your account name, as shown in the following screenshot:
Then, you will be prompted to create your first app. Ensure that you save the details of your account, such as the name of your first app and the key that will be given to you; we are going to need it for the rest of this book.
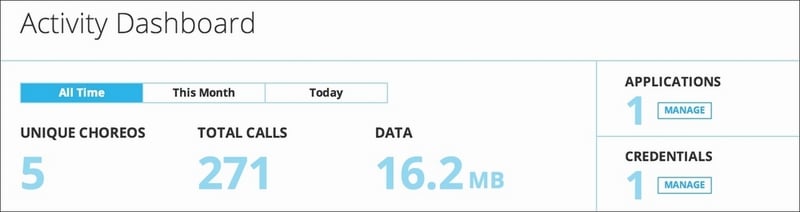
In case you need to get these values again or create a new application, you can always access this data in the My Account section of the Temboo website by clicking on the MANAGE button below APPLICATIONS, just as it is displayed in the following screenshot:
We are now all set to start using the Temboo libraries that are made specifically for the Arduino Yún board and to upload some data to the cloud.
In this section, we are going to use our first Temboo library (called a Choreo) to upload the measurements of the Arduino Yún to the Web and log the data into a Google Docs spreadsheet.
First, let's have a look at what a Choreo is and how you can generate the code for your Arduino Yún board. If you go to the main Temboo page, you will see that you can choose different platforms and languages, such as Arduino, JavaScript, or Python. Each of these links will allow you to select a Choreo, which is a dedicated library written for the platform you chose and can interface with a given web service such as Google Docs.
For the Arduino platform, Temboo even offers to generate the entire code for you. You can click on the Arduino icon on the Temboo website and then click on Arduino Yún; you will get access to a step-by-step interface to generate the code. However, as we want to get complete control of our device and write our own code, we won't use this feature for this project.
Google Docs is really convenient as it's an online (and free) version of the popular Office software from Microsoft. The main difference is that because it's all in the cloud, you don't have to store files locally or save them—it's all done online. For our project, the advantage is that you can access these files remotely from any web browser, even if you are not on your usual computer. You just need your Google account name and password and can access all your files.
If you don't have a Google account yet, you can create one in less than five minutes at https://drive.google.com/.
This will also create an account for the Gmail service, which we will also use later. Please make sure that you have your Google Docs username and password as you are going to need them soon.
Before we start writing any Arduino code, we need to prepare a Google Docs spreadsheet that will host the data. Simply create a new one at the root of your Google Docs account; you can name it whatever you wish (for example, Yun). This is done from the main page of Google Docs just by clicking on Create.
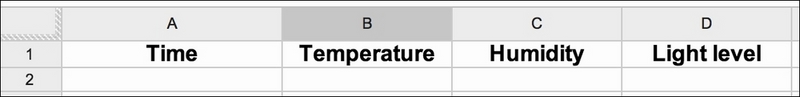
In the spreadsheet, you need to set the name of the columns for the data that will be logged; that is, Time, Temperature, Humidity, and Light level. This is shown in the following screenshot:
Now, let's start building the Arduino sketch inside the Arduino IDE. We first need to import all the necessary libraries, as follows:
#include <Bridge.h>
#include <Temboo.h>
#include <Process.h>
The Bridge library is something that was introduced for the Arduino Yún board and is responsible for making the interface between the Linux machine of the Yún and the Atmel processor, where our Arduino sketch will run. With this library, it's possible to use the power of the Linux machine right inside the Arduino sketch.
The
Process library will be used to run some programs on the Linux side, and the Temboo file will contain all the information that concerns your Temboo account. Please go inside this file to enter the information corresponding to your own account. This is as shown in the following code:
#define TEMBOO_ACCOUNT "temboo_account_name"  // Your Temboo account name
#define TEMBOO_APP_KEY_NAME " temboo_app_name "  // Your Temboo app key name
#define TEMBOO_APP_KEY " temboo_api_key "  // Your Temboo app key
Note
Note that we also included a debug mode in the sketch that you can set to true if you want some debug output to be printed on the serial monitor. However, for an autonomous operation of the board, we suggest that you disable this debugging mode to save some memory inside Yún.
In the sketch, we then have to enter the Google Docs information. You need to put your Google username and password here along with the name of the spreadsheet where you want the data to be logged, as shown in the following code:
const String GOOGLE_USERNAME = "yourUserName";
const String GOOGLE_PASSWORD = "yourPassword";
const String SPREADSHEET_TITLE = "Yun";
In the setup() part of the sketch, we are now starting the bridge between the Linux machine and the Atmel microcontroller by executing the following line of code:
Bridge.begin();
We are also starting a date process so that we can also log the data of when each measurement was recorded, as shown in the following code:
time = millis();
if (!date.running())  {
  date.begin("date");
  date.addParameter("+%D-%T");
  date.run();
}
The date will be in the format: date of the day followed by the time. The date process we are using here is actually a very common utility for Linux, and you can look for the documentation of this function on the Web to learn more about the different date and time formats that you can use.
Now, in the loop() part of the sketch, we send the measurements continuously using the following function:
runAppendRow(lightLevel, temperature, humidity);
Let's get into the details of this function. It starts by declaring the Choreo (the Temboo service) that we are going to use:
TembooChoreo AppendRowChoreo;
The preceding function is specific to Google Docs spreadsheets and works by sending a set of data separated by commas on a given row. There are Choreos for every service that Temboo connects to, such as Dropbox and Twitter. Please refer to the Temboo documentation pages to get the details about this specific Choreo. After declaring the Choreo, we have to add the different parameters of the Choreo as inputs. For example, the Google username, as shown in the following line of code:
AppendRowChoreo.addInput("Username", GOOGLE_USERNAME);The same is done with the other required parameters, as shown in the following code:
AppendRowChoreo.addInput("Password", GOOGLE_PASSWORD);
AppendRowChoreo.addInput("SpreadsheetTitle", SPREADSHEET_TITLE);
The important part of the function is when we actually format the data so that it can be appended to the spreadsheet. Remember, the data needs to be delimited using commas so that it is appended to the correct columns in the spreadsheet, as shown in the following code:
String data = "";
data = data + timeString + "," + String(temperature) + "," + String(humidity) + "," + String(lightLevel);
The Choreo is then executed with the following line of code:
unsigned int returnCode = AppendRowChoreo.run();
The function is then repeated every 10 minutes. Indeed, these values usually change slowly over the course of a day, so this is useless to the data that is logging continuously. Also, remember that the number of calls to Temboo is limited depending on the plan you chose (1000 calls per month on a free plan, which is approximately 1 call per hour). This is done using the delay function, as follows:
delay(600000);
For demonstration purposes, the data is logged every 10 minutes. However, you can change this just by changing the argument of the delay() function. The complete code for this part can be found at https://github.com/openhomeautomation/geeky-projects-yun/tree/master/chapter1/temboo_log.
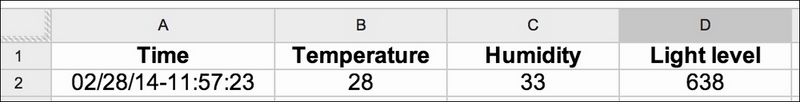
You can now upload the sketch to the Arduino Yún board and open the Google Docs spreadsheet to see what's happening. It's all synchronized live with the Google Docs servers, so you do not need to refresh anything. After a while, you should see the first set of measurements being logged, as shown in the following screenshot:
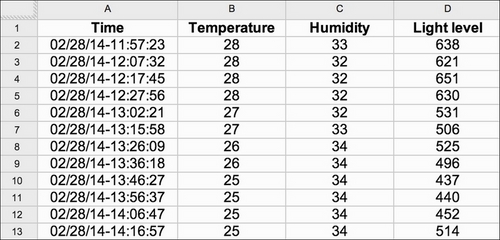
In order to show you what can be done using this project, we used the integrated chart capabilities of Google Docs to plot this data using the measurements that we obtained for over 24 hours. The following screenshot is an extract from the raw data:
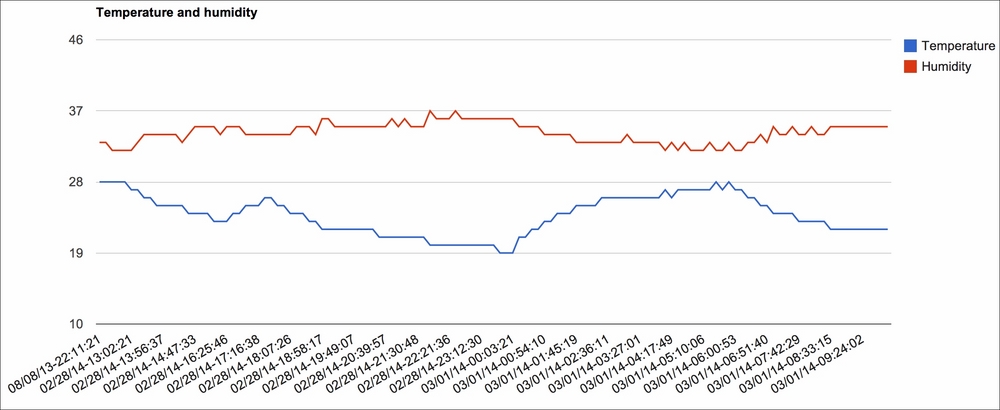
Now, to actually plot some data, you can simply use the Insert charts function of Google Docs. We chose the simple Line graph for our data. The following screenshot shows the results for temperature and humidity:
We did the same for light level measurements, as shown in the following screenshot:
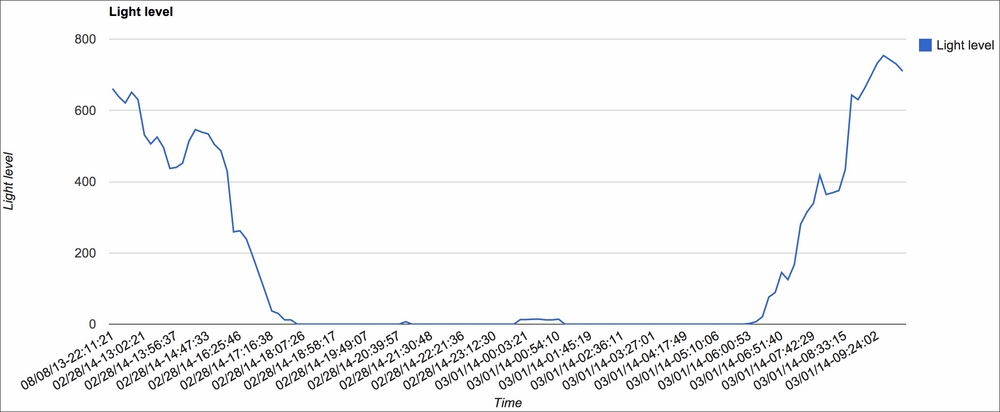
These charts can be placed automatically in their respective sheets inside your spreadsheet and will, of course, be updated automatically as new data comes in. You can also use the sharing capabilities of Google Docs to share these sheets with anyone, so they can also follow the measurements of your home.
In this part, we are not only going to build on what we did in the previous section with Google Docs but also create some automated e-mail alerts on top with a Google account. This time, we will use the Temboo library that interfaces directly with Gmail, in this case, to automatically send an e-mail using your account.
What we will do is program the Arduino Yún board to send an e-mail to the chosen address if the temperature goes below a given level, for example, indicating that you should turn on the heating in your home.
Compared to the previous Arduino sketch, we need to add the destination e-mail address. I used my own address for testing purposes, but of course, this destination address can be completely different from the one of your Gmail account. For example, if you want to automatically e-mail somebody who is responsible for your home if something happens, execute the following line of code:
const String TO_EMAIL_ADDRESS = "your_email_address";
Please note that sending an e-mail to yourself might be seen as spam by your Gmail account. So, it's advisable to send these alerts to another e-mail of your choice, for example, on a dedicated account for these alerts. We also need to set a temperature limit in the sketch. In my version of the project, it is the temperature under which the Arduino Yún will send an e-mail alert, but you can of course modify the meaning of this temperature limit, as shown in the following line of code:
int temperature_limit = 25.0;
In the loop() part of the sketch, what changes compared to the sketch of the previous section is that we can compare the recorded temperature to the limit. This is done with a simple if statement:
if (temperature < temperature_limit) {
  if (debug_mode == true){Serial.println("Sending alert");}
    sendTempAlert("Temperature is too low!");
  }
Then, the alert mechanism occurs in the new function called sendTempAlert that is called if the temperature is below the limit. The function also takes a string as an argument, which is the content of the message that will be sent when the alert is triggered. Inside the function, we start again by declaring the type of Choreo that we will use. This time, the Choreo that we will use is specific to Gmail and is used to send an e-mail with the subject and body of the message, as shown in the following line of code:
TembooChoreo SendEmailChoreo;
Just as the Choreo we used to log data into Google Docs, this new Choreo requires a given set of parameters that are defined in the official Temboo documentation. We need to specify all the required inputs for the Choreo, for example, the e-mail's subject line that you can personalize as well, as shown in the following line of code:
SendEmailChoreo.addInput("Subject", "ALERT: Home Temperature");The body of the message is defined in the following line of code:
SendEmailChoreo.addInput("MessageBody", message);Note that the message variable is the one passed in the loop() part of the sketch and can be personalized as well, for example, by adding the value of the measured temperature. Finally, the Choreo is executed with the following line of code:
SendEmailChoreo.run();
The complete code for this part can be found at https://github.com/openhomeautomation/geeky-projects-yun/tree/master/chapter1/temboo_alerts.
Now, you can compile and update the sketch to your Yún. You can also go to the Gmail interface to check for new e-mails. If the temperature indeed drops below the value that you set as a limit, the following is what you should receive in your inbox:

Again, you can play with this sketch and create more complex alerts based on the data you measured. For example, you can add the humidity and light level in the mix and create dedicated limits and alerts for these values. You can also program Arduino Yún so that it e-mails you the data itself at regular intervals, even if no temperature limit is reached.