Book Image

Network Analysis using Wireshark 2 Cookbook - Second Edition

By : Nagendra Kumar Nainar, Yoram Orzach, Yogesh Ramdoss
Book Image

Network Analysis using Wireshark 2 Cookbook - Second Edition

By: Nagendra Kumar Nainar, Yoram Orzach, Yogesh Ramdoss

Overview of this book

This book contains practical recipes on troubleshooting a data communications network. This second version of the book focuses on Wireshark 2, which has already gained a lot of traction due to the enhanced features that it offers to users. The book expands on some of the subjects explored in the first version, including TCP performance, network security, Wireless LAN, and how to use Wireshark for cloud and virtual system monitoring. You will learn how to analyze end-to-end IPv4 and IPv6 connectivity failures for Unicast and Multicast traffic using Wireshark. It also includes Wireshark capture files so that you can practice what you’ve learned in the book. You will understand the normal operation of E-mail protocols and learn how to use Wireshark for basic analysis and troubleshooting. Using Wireshark, you will be able to resolve and troubleshoot common applications that are used in an enterprise network, like NetBIOS and SMB protocols. Finally, you will also be able to measure network parameters, check for network problems caused by them, and solve them effectively. By the end of this book, you’ll know how to analyze traffic, find patterns of various offending traffic, and secure your network from them.
Table of Contents (20 chapters)

Locating Wireshark

The first step after understanding the problem and deciding to use Wireshark is the decision on where to locate it. For this purpose, we need to have a precise network illustration (at least the part of the network that is relevant to our test) and locate Wireshark.

The principle is basically to locate the device that you want to monitor, connect your laptop to the same switch that it is connected to, and configure a port mirror or in Cisco it is called a port monitor or Switched Port Analyzer (SPAN to the monitored device. This operation enables you to see all traffic coming in and out of the monitored device. This is the simplest case.

You can monitor a LAN port, WAN port, server or router port, or any other device connected to the network.

In the example presented in this diagram, the Wireshark software is installed on the laptop on the left and a server S2 that we want to monitor:

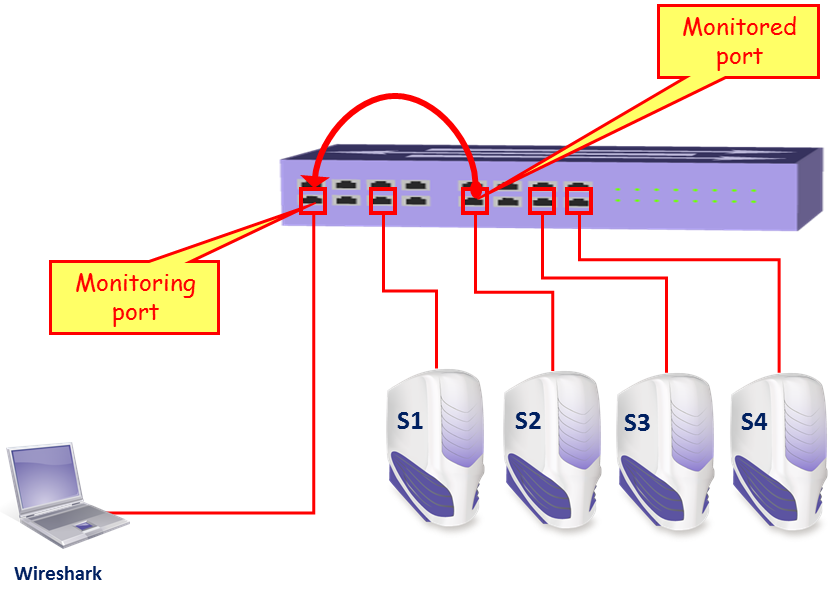
In the simplest case, we configure the port mirror in the direction as in the diagram; that will monitor all traffic coming in and out of server S2. Of course, we can also install Wireshark directly on the server itself, and by doing so we will be able to watch the traffic directly on the server.

Some LAN switch vendors also enable other features, such as:

  • Monitoring a whole VLAN: We can monitor a server's VLAN, telephony VLAN, and so on. In this case, you will see all traffic on a specific VLAN.
  • Monitoring several ports to a single analyzer: We can monitor traffic on servers S1 and S2 together.
  • Filtering: Filtering consists of configuring whether to monitor incoming traffic, outgoing traffic, or both.

Getting ready

To start working with Wireshark, go to the Wireshark website and download the latest version of the tool.

An updated version of Wireshark can be found on the website http://www.wireshark.org/; choose Download. This brings you the Download Wireshark page. Download the latest Wireshark Version 2.X.X stable release that is available at https://www.wireshark.org/#download.

Each Wireshark Windows package comes with the latest stable release of WinPcap, which is required for live packet capture. The WinPcap driver is a Windows version of the UNIX libpcap library for traffic capture.

During the installation, you will get the package's installation window, presented in the following screenshot:

Usually in these setup windows, we simply check all and install. In this case, we have some interesting things:

  • Wireshark: This is the Wireshark version 2 software.
  • TSark: A command-line protocol analyzer.
  • Wireshark 1: The good old Wireshark version 1. When you check this, the legacy Wireshark version 1 will be also installed. Personally, I prefer to install it for the next several versions, so if something doesn't work with Wireshark version 2 or you don't know how to work with it, you always have the good old version available.
  • Plugins & Extensions:
    • Dissector Plugins: Plugins with some extended dissections
    • Tree Statistics Plugins: Extended statistics
    • Mate: Meta-Analysis and Tracing Engine: User-configurable extension(s) of the display filter engine
    • SNMP MIBs: For a more detailed SNMP dissection
  • Tools:
    • Editcap: Reads a capture file and writes some or all of the packets into another capture file
    • Text2Pcap: Reads in an ASCII hex dump and writes the data into a pcap capture file
    • Reordercap: Reords a capture file by timestamp
    • Mergecap: Combines multiple saved capture files into a single output file
    • Capinfos: Provides information on capture files
    • Rawshark: Raw packet filter

How to do it...

Let's take a look at the typical network architecture, the network devices, how they work, how to configure them when required, and where to locate Wireshark:

Let's have a look at the simple and common network architecture in the preceding diagram.

Monitoring a server

This is one of the most common requirements that we have. It can be done by configuring the port monitor to the server (numbered 1 in the preceding diagram) or installing Wireshark on the server itself.

Monitoring a router

In order to monitor a router, we can use the following:

Case 1: Monitoring the switch port that the router is connected to:

  1. In this case, numbered 2 in the previous drawing, we connect our laptop to the switch that the router is connected to
  2. On the switch, configure the port mirror from the port that the router is connected to, to the port that the laptop is connected to

Case 2: Router with a switch module

  1. In this case, numbered 5 and 6 in the previous diagram, we have a switch module on the router (for example, Cisco EtherSwitch® or HWIC modules), we can use it the same way as a standard switch (numbered 5 for the LAN port and 6 for the WAN port, in the previous diagram)
In general, a router does not support the port mirror or SPAN. In the simple Home/SOHO routers, you will not have this option. The port mirror option is available in some cases on switch modules on routers such as Cisco 2800 or 3800, and of course on large-scale routers such as Cisco 6800 and others.
  1. In this case, you will be able to monitor only those ports that are connected to the switch module

Case 3: Router without switch module

  1. In this case you can connect a switch between the router port and the Service Provider (SP) network, and configure the port monitor on this switch, as in the following diagram:
  • In this case, configure the port monitor from the port the router is connected to, to the port your laptop is connected to.
Connecting a switch between the router and the service provider is an operation that breaks the connection, but when you prepare for it, it should take less than a minute.

Case 4: Router with embedded packet capture

In routers from recent years, you will have also an option for integrated packet capture in the router itself. This is the case, for example, in Cisco IOS Release 12.4(20)T or later, Cisco IOS-XE Release 15.2(4)S-3.7.0 or later, and also from SRX/J-Series routers from Juniper, Stealhead from Riverbed, and many other brands.

When using this option, make sure that your device has enough memory for the option, and that you don't load your device to the point you will slow its operation.

When monitoring a router, don't forget this: it might happen that not all packets coming in to a router will be forwarded out! Some packets can be lost, dropped on the router buffers, or routed back on the same port that they came in from, and there are, of course, broadcasts that are not forwarded by the router.

Monitoring a firewall

When monitoring a firewall, it is, of course, different whether you monitor the internal port (numbered 1 in the following diagram) or the external port (numbered 2 in the following diagram):

On the internal port, you will see all the internal addresses and all traffic initiated by the users working in the internal network, while on the external port, you will see the external addresses that we go out with (translated by NAT from the internal addresses), and you will not see requests from the internal network that were blocked by the firewall. If someone is attacking the firewall from the internet, you will see it (hopefully) only on the external port.

In some firewall brands, you also have the option to use an embedded capture engine, as described in the routers, paragraph before.

Test access points and hubs

Two additional devices that you can use are TAPs and Hubs:

  • Test Access Point (TAPs): Instead of connecting a switch to the link you wish to monitor, you can connect a device called a TAP, a simple three-port device that, in this case, will play the same role as the switch. The advantage of a TAP over a switch is the simplicity and price. TAPs also forward errors that can be monitored on Wireshark, unlike a LAN switch that drops them. Switches, on the other hand, are much more expensive, take a few minutes to configure, but provide you with additional monitoring capabilities, for example, SNMP. When you troubleshoot a network, it is better to have an available managed LAN switch, even a simple one, for this purpose.

  • Hubs: You can simply connect a hub in parallel to the link you want to monitor, and since a hub is a half-duplex device, every packet sent between the router and the SP device will be watched on your Wireshark. The biggest con of this method is that the hub itself slows the traffic, and therefore it influences the test. In many cases, you also want to monitor 1 Gbps ports, and since there is no hub available for this, you will have to reduce the speed to 100 Mbps that again will influence the traffic. Therefore, hubs are not commonly used for this purpose.

How it works...

For understanding how the port monitor works, it is first important to understand the way that a LAN switch works. A LAN switch forwards packets in the following way:

  • The LAN switch continuously learns the MAC addresses of the devices connected to it
  • Now, if a packet is sent to a destination MAC, it will be forwarded only to the physical port that the switch has learned that this MAC address is coming from
  • If a broadcast is sent, it will be forwarded to all ports of the switch
  • If a multicast is sent, and CGMP or IGMP is disabled, it will be forwarded to all ports of the switch (CGMP and IGMP are protocols that enable multicast packets to be forwarded only to devices on a specific multicast group)
  • If a packet is sent to a MAC address that the switch has not learned (which is a very rare case), it will be forwarded to all ports of the switch

In the following diagram, you see an example for how a layer 2-based network operates. Every device connected to the network sends periodic broadcasts. It can be ARP requests, NetBIOS advertisements, and others. The moment a broadcast is sent, it is forwarded through the entire layer 2 network (dashed arrows in the drawing). In the example, all switches learn the MAC address M1 on the port they have received it from.

Now, when PC2 wants to send a frame to PC1, it sends the frame to the switch that it is connected to, SW5. SW5 has learned the MAC address M1 on the fifth port to the left, and that is where the frame is forwarded. In the same way, every switch forwards the frame to the port it has learned it from, and finally it is forwarded to PC1.

Therefore, when you configure a port monitor to a specific port, you will see all traffic coming in and out of it. If you connect your laptop to the network, without configuring anything, you will see only traffic coming in and out of your laptop, along with broadcasts and multicasts from the network.

There's more...

There are some tricky scenarios when capturing data that you should be aware of.

Monitoring a VLAN—when monitoring a VLAN, you should be aware of several important issues. The first issue is that even when you monitor a VLAN, the packet must physically be transferred through the switch you are connected to in order to see it. If, for example, you monitor VLAN-10 that is configured across the network, and you are connected to your floor switch, you will not see traffic that goes from other switches to the servers on the central switch. This is because in building networks, the users are usually connected to floor switches, in single or multiple locations in the floor, that are connected to the building central switch (or two redundant switches). For monitoring all traffic on a VLAN, you have to connect to a switch on which all traffic of the VLAN goes through, and this is usually the central switch:

In the preceding diagram, if you connect Wireshark to Switch SW2, and configure a monitor to VLAN30, you will see all packets coming in and out of P2, P4, and P5, inside or outside the switch. You will not see packets transferred between devices on SW3, SW1, or packets between SW1 and SW3.

Another issue when monitoring a VLAN is that you might see duplicate packets. This is because when you monitor a VLAN and packets are going in and out of the VLAN, you will see the same packet when it is coming in and going out of the VLAN.

You can see the reason in the following illustration. When, for example, S4 sends a packet to S2 and you configure the port mirror to VLAN30, you will see the packet once sent from S4 to the switch and entering the VLAN30, and then when leaving VLAN30 to S2:

See also

For information on how to configure the port mirror, refer to the vendor's instructions. It can be called port monitor, port mirror, or SPAN from Cisco.

There are also advanced features such as remote monitoring, when you monitor a port that is not directly connected to your switch, advanced filtering (such as filtering specific MAC addresses), and so on. There are also advanced switches that have capture and analysis capabilities on the switch itself. It is also possible to monitor virtual ports (for example, a LAG or EtherChannel groups). For all cases, and other cases described in this recipe, refer to the vendor's specifications.

For vendor information you can look, for example, at these links: