

Zabbix proxies can operate in two different modes, active and passive. The default setup is the active proxy. In this setup, the proxy initiates all connections to the Zabbix server, the one used to retrieve configuration information on monitored objects, and the connection to send measurements back to the server. Here, you can change and tweak the frequency of these two activities by setting the following variables in the proxy configuration file: /etc/zabbix/zabbix_proxy.conf:
ConfigFrequency=3600
DataSenderFrequency=1
Values are expressed in seconds. On the Zabbix server-side, you need to carefully set the value of StartTrappers=.
This value needs to be greater than the number of all active proxies and nodes you deployed. The trapper processes, indeed, manage all the incoming information from the proxies.
Note
Please note that the server will fork extra processes as required, if needed, but it is strongly advisable to prefork all the processes that are needed during the startup. This will reduce the overhead during the normal operation.
On the proxy side, another parameter to consider is:
HeartbeatFrequency
This parameter sets a sort of keep alive, which after the defined number of seconds, will contact the server although it doesn't have any data to send. The proxy availability can be easily checked with the following item:
zabbix[proxy, "proxy unique name", lastaccess]
Here the proxy unique name, of course, is the identifier you assigned to the proxy during deployment. The item will return the number of seconds as the last time that the proxy was contacted, a value you can then use with the appropriate triggering functions.
Tip
It's really important to have a trigger associated to this item, so you can be warned in case of connection loss. Looking at the trend of this trigger, you can learn about an eventual reaping time set on the firewall. Let's look at a practical example: if you notice that after 5 minutes your connections are dropped, set the heartbeat frequency to 120 seconds and check for the last access time above 300 seconds.
In the following diagram, you can see the communication flow between the Zabbix server and the proxy:
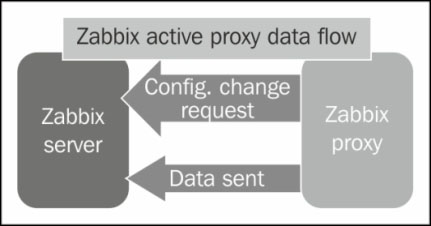
As you can see from the diagram, the server will wait to receive requests from the proxy and nothing more.
Note
The active proxy is the most efficient way to offload duties from the server. Indeed, the server will just sit here waiting to be asked about changes in configuration, or to receive new monitoring data.
On the other side, proxies are usually deployed to monitor secure network segments with strict outgoing traffic policies, and are usually installed on DMZs. In these kind of scenarios, normally, it is very difficult to obtain permission for the proxy to initiate the communication with the server. Unfortunately, it's not just due to policies. DMZs are isolated as much as possible from internal networks, as they need to be as secure as they can. Generally, it's often easier and more accepted from a security point of view to initiate a connection from the internal network to a DMZ. In this kind of scenario, the passive proxy is very helpful. The passive proxy is almost a mirrored image of the active proxy setup, as you can see in the following diagram:
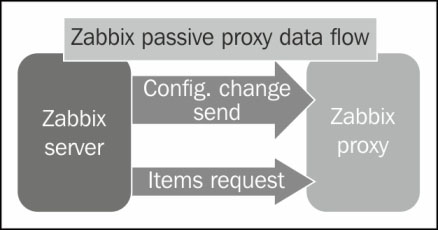
With this configuration, the Zabbix server will contact the proxy periodically to deliver the configuration changes and to request the item values the proxy is holding.
This is the proxy configuration to enable the proxy you need to set:
ProxyMode=1
This parameter specifies the passive proxy, you don't need to do anything else. Now, on the server side, you need to set the following parameters:
StartProxyPollers=This will set the number of processes dedicated to the passive proxies
ProxyConfigFrequency=This value expresses the frequency with which the server sends the configuration to its proxy
ProxyDataFrequency=This is the interval parameter that expresses the number of seconds between two consecutive requests to get the acquired metrics from the proxy
The item used to check a passive proxy's availability is as follows:
zabbix[proxy, "proxy unique name", lastaccess]
This is exactly the same as the active one.
The passive proxy enables us to gather monitoring data from otherwise closed and locked down networks with a slightly increased overhead.
Note
You can mix as many active and passive proxies as you want in your environment. This enables you to expand your monitoring solution to reach each part of the network and to handle a large number of monitored objects. This approach keeps the architecture simple and easy to manage with a strong central core and many simple, lightweight satellites.
If you would like to keep track of all the remaining items that the proxy needs to send, you can set up the proxy to run this query against its database:
SELECT ((SELECT MAX(proxy_history.id) FROM proxy_history)-nextid) FROM ids WHERE field_name='history_lastid'
Tip
Downloading the example code
You can download the example code files from your account at http://www.packtpub.com for all the Packt Publishing books you have purchased. If you purchased this book elsewhere, you can visit http://www.packtpub.com/support and register to have the files e-mailed directly to you.
This query will return the number of items that the proxy still needs to send to the Zabbix server. Considering that you are using MySQL as a database, you need to add the following user parameter in the proxy agent configuration file:
UserParameter=zabbix.proxy.items.sync.remaining, mysql -u <your dbname here> -p '<your password here>' -e 'SELECT ((SELECT MAX(proxy_history.id) FROM proxy_history)-nextid) FROM ids WHERE field_name=history_lastid' 2>&1
Now, all you need to do is set an item on the Zabbix server side and you can see how your proxy is freeing its queue.