

As you write JavaScript applications, you will soon realize that having a sound testing strategy is indispensable. In fact, not writing enough tests is almost always a bad idea. It is essential to cover all the non-trivial functionality of your code to make sure of the following points:
- The existing code behaves as per the specifications
- Any new code does not break the behavior defined by the specifications
Both these points are very important. Many engineers consider only the first point the sole reason to cover your code with enough tests. The most obvious advantage of test coverage is to really make sure that the code being pushed to the production system is mostly error-free. Writing test cases to smartly cover the maximum functional areas of the code generally gives you a good indication about the overall quality of the code. There should be no arguments or compromises around this point. It is unfortunate though that many production systems are still bereft of adequate code coverage. It is very important to build an engineering culture where developers think about writing tests as much as they think about writing code.
The second point is even more important. Legacy systems are usually very difficult to manage. When you are working on code written either by someone else or a large distributed team, it is fairly easy to introduce bugs and break things. Even the best engineers make mistakes. When you are working on a large code base that you are unfamiliar with and if there is no sound test coverage to help you, you will introduce bugs. As you won't have the confidence in the changes that you are making (because there are no test cases to confirm your changes), your code releases will be shaky, slow, and obviously full of hidden bugs.
You will refrain from refactoring or optimizing your code because you won't really be sure what changes to the code base would potentially break something (again, because there are no test cases to confirm your changes)—all this is a vicious circle. It's like a civil engineer saying, "though I have constructed this bridge, I have no confidence in the quality of the construction. It may collapse immediately or never." Though this may sound like an exaggeration, I have seen a lot of high impact production code being pushed with no test coverage. This is risky and should be avoided. When you are writing enough test cases to cover majority of your functional code and when you make a change to these pieces, you immediately realize if there is a problem with this new change. If your changes make the test case fail, you realize the problem. If your refactoring breaks the test scenario, you realize the problem—all this happens much before the code is pushed to production.
In recent years, ideas such as test-driven development and self-testing code are gaining prominence, especially in agile methodology. These are fundamentally sound ideas and will help you write robust code—code that you are confident of. We will discuss all these ideas in this chapter. You will understand how to write good test cases in modern JavaScript. We will also look at several tools and methods to debug your code. JavaScript has been traditionally a bit difficult to test and debug primarily due to lack of tools, but modern tools make both of these easy and natural.
When we talk about test cases, we mostly mean unit tests. It is incorrect to assume that the unit that we want to test is always a function. The unit (or unit of work) is a logical unit that constitutes a single behavior. This unit should be able to be invoked via a public interface and should be testable independently.
Thus, a unit test performs the following functions:
- It tests a single logical function
- It can be run without a specific order of execution
- It takes care of its own dependencies and mock data
- It always returns the same result for the same input
- It should be self-explanatory, maintainable, and readable
Note
Martin Fowler advocates the test pyramid (http://martinfowler.com/bliki/TestPyramid.html) strategy to make sure that we have a high number of unit tests to ensure maximum code coverage. The test pyramid says that you should write many more low-level unit tests than higher level integration and UI tests.
There are two important testing strategies that we will discuss in this chapter.
Test-driven development (TDD) has gained a lot of prominence in the last few years. The concept was first proposed as part of the Extreme Programming methodology. The idea is to have short repetitive development cycles where the focus is on writing the test cases first. The cycle looks as follows:
- Add a test case as per the specifications for a specific unit of code.
- Run the existing suite of test cases to see if the new test case that you wrote fails—it should (because there is no code for this unit yet). This step ensures that the current test harness works well.
- Write the code that serves mainly to confirm the test case. This code is not optimized or refactored or even entirely correct. However, this is fine at the moment.
- Rerun the tests and see if all the test cases pass. After this step, you will be confident that the new code is not breaking anything.
- Refactor the code to make sure that you are optimizing the unit and handling all corner cases.
These steps are repeated for all the new code that you add. This is an elegant strategy that works really well for the agile methodology. TDD will be successful only if the testable units of code are small and confirm only to the test case and nothing more. It is important to write small, modular, and precise code units that have input and output confirming the test case.
A very common problem while trying to follow TDD is vocabulary and the definition of correctness. BDD tries to introduce a ubiquitous language while writing the test cases when you are following TDD. This language makes sure that both the business and engineering teams are talking about the same thing.
We will use Jasmine as the primary BDD framework and explore various testing strategies.
Note
You can install Jasmine by downloading the standalone package from https://github.com/jasmine/jasmine/releases/download/v2.3.4/jasmine-standalone-2.3.4.zip.
When you unzip this package, you will have the following directory structure:
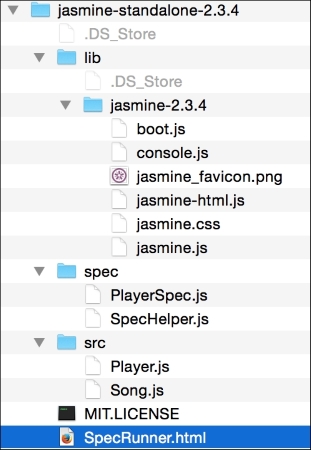
The lib directory contains the JavaScript files that you need in your project to start writing Jasmine test cases. If you open
SpecRunner.html, you will find the following JavaScript files included in it:
<script src="lib/jasmine-2.3.4/jasmine.js"></script> <script src="lib/jasmine-2.3.4/jasmine-html.js"></script> <script src="lib/jasmine-2.3.4/boot.js"></script> <!-- include source files here... --> <script src="src/Player.js"></script> <script src="src/Song.js"></script> <!-- include spec files here... --> <script src="spec/SpecHelper.js"></script> <script src="spec/PlayerSpec.js"></script>
The first three are Jasmine's own framework files. The next section includes the source files that we want to test and the actual test specifications.
Let's experiment with Jasmine with a very ordinary example. Create a bigfatjavascriptcode.js file and place it in the src/ directory. We will test the following function:
function capitalizeName(name){
return name.toUpperCase();
}This is a simple function that does one single thing. It receives a string and returns a capitalized string. We will test various scenarios around this function. This is the unit of code that we discussed earlier.
Next, create the test specifications. Create one JavaScript file, test.spec.js, and place it in the spec/ directory. The file should contain the following. You will need to add the following two lines to SpecRunner.html:
<script src="src/bigfatjavascriptcode.js"></script> <script src="spec/test.spec.js"></script>
The order of this inclusion does not matter. When we run SpecRunner.html, you will see something as follows:
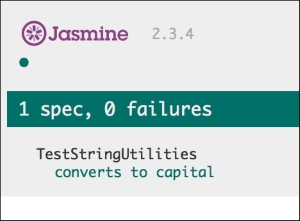
This is the Jasmine report that shows the details about the number of tests that were executed and the count of failures and successes. Now, let's make the test case fail. We want to test a case where an undefined variable is passed to the function. Add one more test case as follows:
it("can handle undefined", function() {
var str= undefined;
expect(capitalizeName(str)).toEqual(undefined);
});Now, when you run SpecRunner.html, you will see the following result:
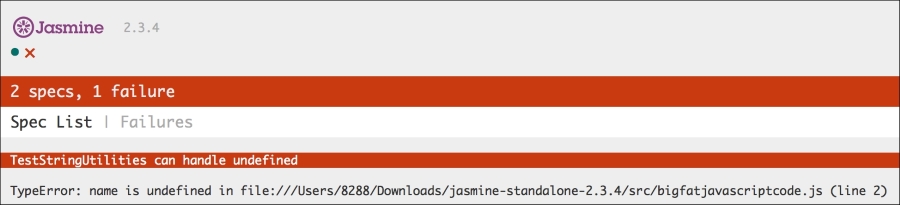
As you can see, the failure is displayed for this test case in a detailed error stack. Now, we go about fixing this. In your original JavaScript code, we can handle an undefined condition as follows:
function capitalizeName(name){
if(name){
return name.toUpperCase();
}
}With this change, your test case will pass and you will see the following in the Jasmine report:
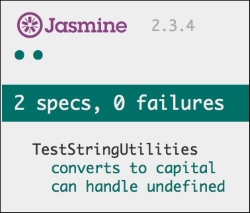
This is very similar to what a test-driven development would look. You write test cases, you then fill in the necessary code to confirm to the specifications, and rerun the test suite. Let's understand the structure of the Jasmine tests.
Our test specification looks as follows:
describe("TestStringUtilities", function() {
it("converts to capital", function() {
var str = "albert";
expect(capitalizeName(str)).toEqual("ALBERT");
});
it("can handle undefined", function() {
var str= undefined;
expect(capitalizeName(str)).toEqual(undefined);
});
});The describe("TestStringUtilities" is a test suite. The name of the test suite should describe the unit of code that we are testing—this can be a function or group of related functionality. In the specifications, you call the global Jasmine it function to which you pass the title of the specification and test function used by the test case. This function is the actual test case. You can catch one or more assertions or the general expectations using the expect function. When all expectations are true, your specification is passed. You can write any valid JavaScript code in the describe and it functions. The values that you verify as part of the expectations are matched using a matcher. In our example, toEqual() is the matcher that matches two values for equality. Jasmine contains a rich set of matches to suit most of the common use cases. Some common matchers supported by Jasmine are as follows:
toBe(): This matcher checks whether two objects being compared are equal. This is the same as the===comparison, as shown in the following code:var a = { value: 1}; var b = { value: 1 }; expect(a).toEqual(b); // success, same as == comparison expect(b).toBe(b); // failure, same as === comparison expect(a).toBe(a); // success, same as === comparisonnot: You can negate a matcher with anotprefix. For example,expect(1).not.toEqual(2);will negate the match made bytoEqual().toContain(): This checks whether an element is part of an array. This is not an exact object match astoBe(). For example, look at the following code:expect([1, 2, 3]).toContain(3); expect("astronomy is a science").toContain("science");toBeDefined()andtoBeUndefined(): These two matches are handy to check whether a variable is undefined (or not).toBeNull(): This checks whether a variable's value isnull.toBeGreaterThan()andtoBeLessThan(): These matchers perform numeric comparisons (they work on strings too):expect(2).toBeGreaterThan(1); expect(1).toBeLessThan(2); expect("a").toBeLessThan("b");
One interesting feature of Jasmine is the spies. When you are writing a large system, it is not possible to make sure that all systems are always available and correct. At the same time, you don't want your unit tests to fail due to a dependency that may be broken or unavailable. To simulate a situation where all dependencies are available for a unit of code that we want to test, we mock these dependencies to always give the response that we expect. Mocking is an important aspect of testing and most testing frameworks provide support for the mocking. Jasmine allows mocking using a feature called a spy. Jasmine spies essentially stub the functions that we may not have ready; at the time of writing the test case but as part of the functionality, we need to track that we are executing these dependencies and not ignoring them. Consider the following example:
describe("mocking configurator", function() {
var configurator = null;
var responseJSON = {};
beforeEach(function() {
configurator = {
submitPOSTRequest: function(payload) {
//This is a mock service that will eventually be replaced
//by a real service
console.log(payload);
return {"status": "200"};
}
};
spyOn(configurator, 'submitPOSTRequest').and.returnValue({"status": "200"});
configurator.submitPOSTRequest({
"port":"8000",
"client-encoding":"UTF-8"
});
});
it("the spy was called", function() {
expect(configurator.submitPOSTRequest).toHaveBeenCalled();
});
it("the arguments of the spy's call are tracked", function() {
expect(configurator.submitPOSTRequest).toHaveBeenCalledWith({"port":"8000","client-encoding":"UTF-8"});
});
});In this example, while we are writing this test case, we either don't have the real implementation of the configurator.submitPOSTRequest() dependency or someone is fixing this particular dependency. In any case, we don't have it available. For our test to work, we need to mock it. Jasmine spies allow us to replace a function with its mock and track its execution.
In this case, we need to ensure that we called the dependency. When the actual dependency is ready, we will revisit this test case to make sure that it fits the specifications, but at this time, all that we need to ensure is that the dependency is called. The Jasmine tohaveBeenCalled() function lets us track the execution of a function, which may be a mock. We can use toHaveBeenCalledWith() that allows us to determine if the stub function was called with the correct parameters. There are several other interesting scenarios that you can create using Jasmine spies. The scope of this chapter won't permit us to cover them all, but I would encourage you to discover these areas on your own.
Note
You can refer to the user manual for Jasmine for more information on Jasmine spies at http://jasmine.github.io/2.0/introduction.html.
Tip
Mocha, Chai, and Sinon
Though Jasmine is the most prominent JavaScript testing framework, Mocha and Chai are gaining prominence in the Node.js environment. Mocha is the testing framework used to describe and run test cases. Chai is the assertion library supported by Mocha. Sinon.JS comes in handy while creating mocks and stubs for your tests. We won't discuss these frameworks in this book, but experience on Jasmine will be handy if you want to experiment with these frameworks.
If you are not a completely new programmer, I am sure you must have spent some amount of time debugging your or someone else's code. Debugging is almost like an art form. Every language has different methods and challenges around debugging. JavaScript has traditionally been a difficult language to debug. I have personally spent days and nights of misery trying to debug badly-written JavaScript code using alert() functions. Fortunately, modern browsers such as Mozilla Firefox and Google Chrome have excellent developer tools to help debug JavaScript in the browser. There are IDEs like
IntelliJ WebStorm with great debugging support for JavaScript and Node.js. In this chapter, we will focus primarily on Google Chrome's built-in developer tool. Firefox also supports the Firebug extension and has excellent built-in developer tools, but as they behave more or less the same as Google Chrome's
Developer Tools (DevTools), we will discuss common debugging approaches that work in both of these tools.
Before we talk about the specific debugging techniques, let's understand the type of errors that we would be interested in while we try to debug our code.
When your code has something that does not confirm to the JavaScript language grammar, the interpreter rejects this piece of code. These are easy to catch if your IDE is helping you with syntax checking. Most modern IDEs help with these errors. Earlier, we discussed the usefulness of the tools such as JSLint and JSHint around catching syntax issues with your code. They analyze the code and flag errors in the syntax. JSHint output can be very illuminating. For example, the following output shows up so many things that we can change in the code. This snippet is from one of my existing projects:
temp git:(dev_branch) ✗ jshint test.js
test.js: line 1, col 1, Use the function form of "use strict".
test.js: line 4, col 1, 'destructuring expression' is available in ES6 (use esnext option) or Mozilla JS extensions (use moz).
test.js: line 44, col 70, 'arrow function syntax (=>)' is only available in ES6 (use esnext option).
test.js: line 61, col 33, 'arrow function syntax (=>)' is only available in ES6 (use esnext option).
test.js: line 200, col 29, Expected ')' to match '(' from line 200 and instead saw ':'.
test.js: line 200, col 29, 'function closure expressions' is only available in Mozilla JavaScript extensions (use moz option).
test.js: line 200, col 37, Expected '}' to match '{' from line 36 and instead saw ')'.
test.js: line 200, col 39, Expected ')' and instead saw '{'.
test.js: line 200, col 40, Missing semicolon.We briefly discussed the
strict mode in earlier chapters. The strict mode in JavaScript flags or eliminates some of the JavaScript silent errors. Rather than silently failing, the strict mode makes these failures throw errors instead. The strict mode also helps in converting mistakes to actual errors. There are two ways of enforcing the strict mode. If you want the strict mode for the entire script, you can just add the use strict statement as the first line of your JavaScript program. If you want a specific function to conform with the strict mode, you can add the directive as the first line of a function:
function strictFn(){
// This line makes EVERYTHING under this strict mode
'use strict';
…
function nestedStrictFn() {
//Everything in this function is also nested
…
}
}These errors appear when you execute the code and try to refer to an undefined variable or process a null. When a runtime exception occurs, any code after that particular line (which caused the exception) does not get executed. It is essential to handle such exceptional scenarios correctly in the code. While exception handling can help prevent crashes, they also aid in debugging. You can wrap the code that may encounter a runtime exception in a try{ } block. When any code in this block generates a runtime exception, a corresponding handler captures it. The handler is defined by a catch(exception){} block. Let's clarify this using an example:
try {
var a = doesnotexist; // throws a runtime exception
} catch(e) {
console.log(e.message); //handle the exception
//prints - "doesnotexist is not defined"
}In this example, the var a = doesnotexist; line tries to assign an undefined variable, doesnotexist, to another variable, a. This causes a runtime exception. When we wrap this problematic code in the try{} catch(){} block and when the exception occurs (or is thrown), the execution stops in the try{} block and goes directly to the catch() {} handler. The catch handler is responsible for handling the exceptional scenario. In this case, we are displaying the error message on the console for debugging purposes. You can explicitly throw an exception to trigger an unhandled scenario in the code. Consider the following example:
function engageGear(gear){
if(gear==="R"){ console.log ("Reversing");}
if(gear==="D"){ console.log ("Driving");}
if(gear==="N"){ console.log ("Neutral/Parking");}
throw new Error("Invalid Gear State");
}
try
{
engageGear("R"); //Reversing
engageGear("P"); //Invalid Gear State
}
catch(e){
console.log(e.message);
}In this example, we are handling valid states of a gear shift (R, N, and D), but when we receive an invalid state, we are explicitly throwing an exception clearly stating the reason. When we call the function that we think may throw an exception, we wrap the code in the try{} block and attach a catch(){} handler with it. When the exception is caught by the catch() block, we handle the exceptional condition appropriately.
Displaying the state of execution on the console can be very useful while debugging. However, modern developer tools allow you to put breakpoints and halt execution to inspect a particular value during runtime. You can quickly detect small issues by logging some variable state on the console.
With these concepts, let's see how we can use Chrome Developer Tools to debug JavaScript code.
You can start Chrome DevTools by navigating to menu | More tools | Developer Tools:
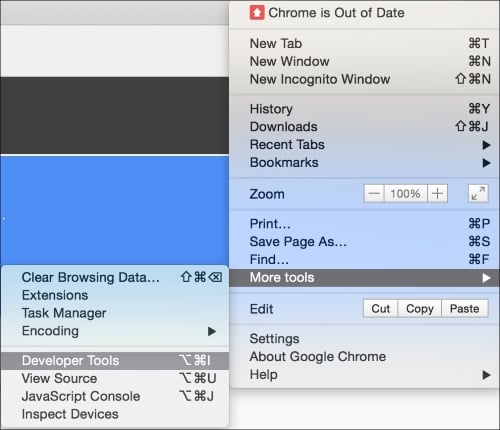
Chrome DevTools opens up on the lower pane of your browser and has a bunch of very useful sections:
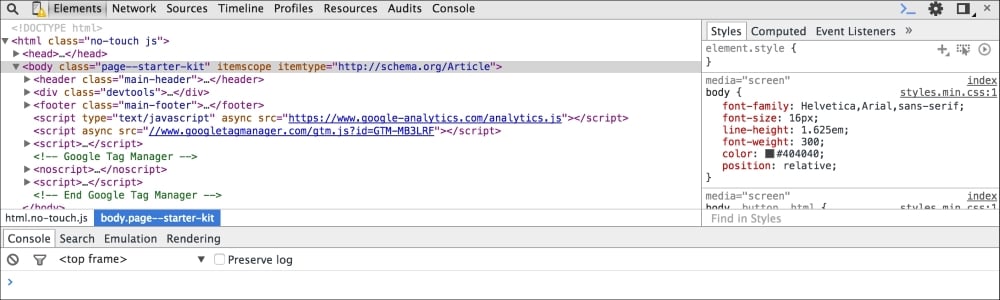
The Elements panel helps you inspect and monitor the DOM tree and associated style sheet for each of these components.
The Network panel is useful to understand network activity. For example, you can monitor the resources being downloaded over the network in real time.
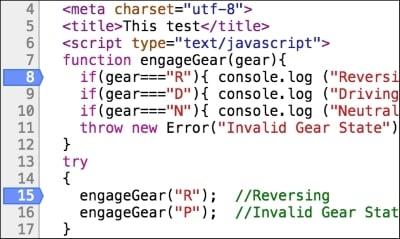
The most important pane for us is the Sources pane. This pane is where the JavaScript source and debugger are displayed. Let's create a sample HTML with the following content:
<!DOCTYPE html>
<html>
<head>
<meta charset="utf-8">
<title>This test</title>
<script type="text/javascript">
function engageGear(gear){
if(gear==="R"){ console.log ("Reversing");}
if(gear==="D"){ console.log ("Driving");}
if(gear==="N"){ console.log ("Neutral/Parking");}
throw new Error("Invalid Gear State");
}
try
{
engageGear("R"); //Reversing
engageGear("P"); //Invalid Gear State
}
catch(e){
console.log(e.message);
}
</script>
</head>
<body>
</body>
</html>Save this HTML file and open it in Google Chrome. Open DevTools in the browser and you will see the following screen:
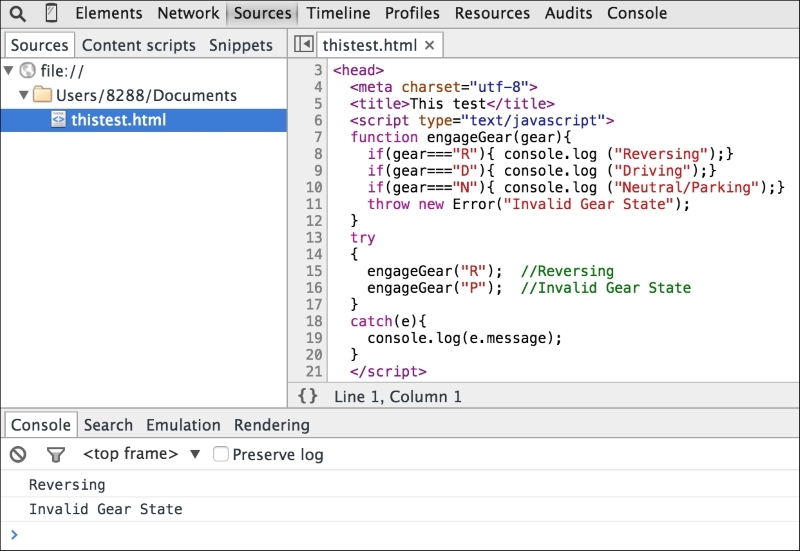
This is the view of the Sources panel. You can see the HTML and embedded JavaScript source in this panel. You can see the Console window as well. You can see that the file is executed and output is displayed in the Console.
On the right-hand side, you will see the debugger window:
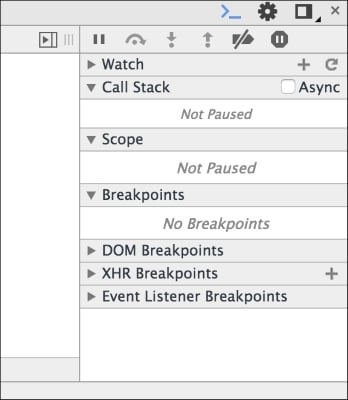
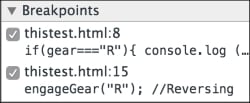
In the Sources panel, click on the line numbers 8 and 15 to add a breakpoint. The breakpoints allow you to stop the execution of the script at the specified point:
In the debugging pane, you can see all the existing breakpoints:
Now, when you rerun the same page, you will see that the execution stops at the debug point. One very useful technique is to inject code during the debugging phase. While the debugger is running, you can add code in order to help you understand the state of the code better:
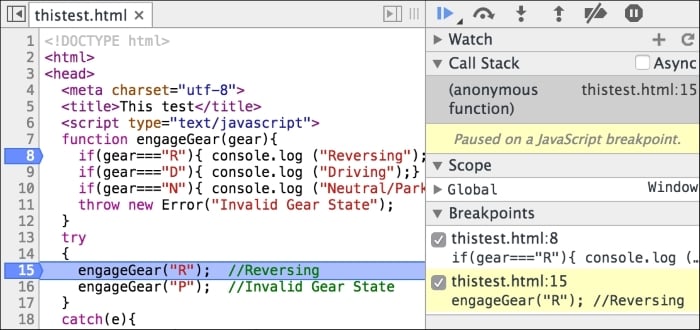
This window now has all the action. You can see that the execution is paused on line 15. In the debug window, you can see which breakpoint is being triggered. You can see the Call Stack also. You can resume execution in several ways. The debug command window has a bunch of actions:

You can resume execution (which will execute until the next breakpoint) by clicking on the  button. When you do this, the execution continues until the next breakpoint is encountered. In our case, we halt at line 8:
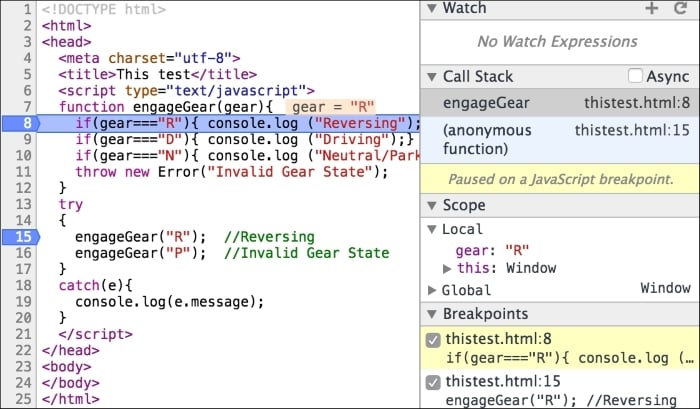
You can observe that the Call Stack window shows you how we arrived at line 8. The Scope panel shows the Local scope where you can see the variables in the scope when the breakpoint was arrived at. You can also step into or step over the next function.
There are other very useful mechanisms to debug and profile your code using Chrome DevTools. I would suggest you to go experiment with the tool and make it a part of your regular development flow.
Syntax errors
When your code has something that does not confirm to the JavaScript language grammar, the interpreter rejects this piece of code. These are easy to catch if your IDE is helping you with syntax checking. Most modern IDEs help with these errors. Earlier, we discussed the usefulness of the tools such as JSLint and JSHint around catching syntax issues with your code. They analyze the code and flag errors in the syntax. JSHint output can be very illuminating. For example, the following output shows up so many things that we can change in the code. This snippet is from one of my existing projects:
temp git:(dev_branch) ✗ jshint test.js
test.js: line 1, col 1, Use the function form of "use strict".
test.js: line 4, col 1, 'destructuring expression' is available in ES6 (use esnext option) or Mozilla JS extensions (use moz).
test.js: line 44, col 70, 'arrow function syntax (=>)' is only available in ES6 (use esnext option).
test.js: line 61, col 33, 'arrow function syntax (=>)' is only available in ES6 (use esnext option).
test.js: line 200, col 29, Expected ')' to match '(' from line 200 and instead saw ':'.
test.js: line 200, col 29, 'function closure expressions' is only available in Mozilla JavaScript extensions (use moz option).
test.js: line 200, col 37, Expected '}' to match '{' from line 36 and instead saw ')'.
test.js: line 200, col 39, Expected ')' and instead saw '{'.
test.js: line 200, col 40, Missing semicolon.We briefly discussed the
strict mode in earlier chapters. The strict mode in JavaScript flags or eliminates some of the JavaScript silent errors. Rather than silently failing, the strict mode makes these failures throw errors instead. The strict mode also helps in converting mistakes to actual errors. There are two ways of enforcing the strict mode. If you want the strict mode for the entire script, you can just add the use strict statement as the first line of your JavaScript program. If you want a specific function to conform with the strict mode, you can add the directive as the first line of a function:
function strictFn(){
// This line makes EVERYTHING under this strict mode
'use strict';
…
function nestedStrictFn() {
//Everything in this function is also nested
…
}
}These errors appear when you execute the code and try to refer to an undefined variable or process a null. When a runtime exception occurs, any code after that particular line (which caused the exception) does not get executed. It is essential to handle such exceptional scenarios correctly in the code. While exception handling can help prevent crashes, they also aid in debugging. You can wrap the code that may encounter a runtime exception in a try{ } block. When any code in this block generates a runtime exception, a corresponding handler captures it. The handler is defined by a catch(exception){} block. Let's clarify this using an example:
try {
var a = doesnotexist; // throws a runtime exception
} catch(e) {
console.log(e.message); //handle the exception
//prints - "doesnotexist is not defined"
}In this example, the var a = doesnotexist; line tries to assign an undefined variable, doesnotexist, to another variable, a. This causes a runtime exception. When we wrap this problematic code in the try{} catch(){} block and when the exception occurs (or is thrown), the execution stops in the try{} block and goes directly to the catch() {} handler. The catch handler is responsible for handling the exceptional scenario. In this case, we are displaying the error message on the console for debugging purposes. You can explicitly throw an exception to trigger an unhandled scenario in the code. Consider the following example:
function engageGear(gear){
if(gear==="R"){ console.log ("Reversing");}
if(gear==="D"){ console.log ("Driving");}
if(gear==="N"){ console.log ("Neutral/Parking");}
throw new Error("Invalid Gear State");
}
try
{
engageGear("R"); //Reversing
engageGear("P"); //Invalid Gear State
}
catch(e){
console.log(e.message);
}In this example, we are handling valid states of a gear shift (R, N, and D), but when we receive an invalid state, we are explicitly throwing an exception clearly stating the reason. When we call the function that we think may throw an exception, we wrap the code in the try{} block and attach a catch(){} handler with it. When the exception is caught by the catch() block, we handle the exceptional condition appropriately.
Displaying the state of execution on the console can be very useful while debugging. However, modern developer tools allow you to put breakpoints and halt execution to inspect a particular value during runtime. You can quickly detect small issues by logging some variable state on the console.
With these concepts, let's see how we can use Chrome Developer Tools to debug JavaScript code.
You can start Chrome DevTools by navigating to menu | More tools | Developer Tools:
Chrome DevTools opens up on the lower pane of your browser and has a bunch of very useful sections:
The Elements panel helps you inspect and monitor the DOM tree and associated style sheet for each of these components.
The Network panel is useful to understand network activity. For example, you can monitor the resources being downloaded over the network in real time.
The most important pane for us is the Sources pane. This pane is where the JavaScript source and debugger are displayed. Let's create a sample HTML with the following content:
<!DOCTYPE html>
<html>
<head>
<meta charset="utf-8">
<title>This test</title>
<script type="text/javascript">
function engageGear(gear){
if(gear==="R"){ console.log ("Reversing");}
if(gear==="D"){ console.log ("Driving");}
if(gear==="N"){ console.log ("Neutral/Parking");}
throw new Error("Invalid Gear State");
}
try
{
engageGear("R"); //Reversing
engageGear("P"); //Invalid Gear State
}
catch(e){
console.log(e.message);
}
</script>
</head>
<body>
</body>
</html>Save this HTML file and open it in Google Chrome. Open DevTools in the browser and you will see the following screen:
This is the view of the Sources panel. You can see the HTML and embedded JavaScript source in this panel. You can see the Console window as well. You can see that the file is executed and output is displayed in the Console.
On the right-hand side, you will see the debugger window:
In the Sources panel, click on the line numbers 8 and 15 to add a breakpoint. The breakpoints allow you to stop the execution of the script at the specified point:
In the debugging pane, you can see all the existing breakpoints:
Now, when you rerun the same page, you will see that the execution stops at the debug point. One very useful technique is to inject code during the debugging phase. While the debugger is running, you can add code in order to help you understand the state of the code better:
This window now has all the action. You can see that the execution is paused on line 15. In the debug window, you can see which breakpoint is being triggered. You can see the Call Stack also. You can resume execution in several ways. The debug command window has a bunch of actions:
You can resume execution (which will execute until the next breakpoint) by clicking on the button. When you do this, the execution continues until the next breakpoint is encountered. In our case, we halt at line 8:
You can observe that the Call Stack window shows you how we arrived at line 8. The Scope panel shows the Local scope where you can see the variables in the scope when the breakpoint was arrived at. You can also step into or step over the next function.
There are other very useful mechanisms to debug and profile your code using Chrome DevTools. I would suggest you to go experiment with the tool and make it a part of your regular development flow.
Using strict
We briefly discussed the
strict mode in earlier chapters. The strict mode in JavaScript flags or eliminates some of the JavaScript silent errors. Rather than silently failing, the strict mode makes these failures throw errors instead. The strict mode also helps in converting mistakes to actual errors. There are two ways of enforcing the strict mode. If you want the strict mode for the entire script, you can just add the use strict statement as the first line of your JavaScript program. If you want a specific function to conform with the strict mode, you can add the directive as the first line of a function:
function strictFn(){
// This line makes EVERYTHING under this strict mode
'use strict';
…
function nestedStrictFn() {
//Everything in this function is also nested
…
}
}These errors appear when you execute the code and try to refer to an undefined variable or process a null. When a runtime exception occurs, any code after that particular line (which caused the exception) does not get executed. It is essential to handle such exceptional scenarios correctly in the code. While exception handling can help prevent crashes, they also aid in debugging. You can wrap the code that may encounter a runtime exception in a try{ } block. When any code in this block generates a runtime exception, a corresponding handler captures it. The handler is defined by a catch(exception){} block. Let's clarify this using an example:
try {
var a = doesnotexist; // throws a runtime exception
} catch(e) {
console.log(e.message); //handle the exception
//prints - "doesnotexist is not defined"
}In this example, the var a = doesnotexist; line tries to assign an undefined variable, doesnotexist, to another variable, a. This causes a runtime exception. When we wrap this problematic code in the try{} catch(){} block and when the exception occurs (or is thrown), the execution stops in the try{} block and goes directly to the catch() {} handler. The catch handler is responsible for handling the exceptional scenario. In this case, we are displaying the error message on the console for debugging purposes. You can explicitly throw an exception to trigger an unhandled scenario in the code. Consider the following example:
function engageGear(gear){
if(gear==="R"){ console.log ("Reversing");}
if(gear==="D"){ console.log ("Driving");}
if(gear==="N"){ console.log ("Neutral/Parking");}
throw new Error("Invalid Gear State");
}
try
{
engageGear("R"); //Reversing
engageGear("P"); //Invalid Gear State
}
catch(e){
console.log(e.message);
}In this example, we are handling valid states of a gear shift (R, N, and D), but when we receive an invalid state, we are explicitly throwing an exception clearly stating the reason. When we call the function that we think may throw an exception, we wrap the code in the try{} block and attach a catch(){} handler with it. When the exception is caught by the catch() block, we handle the exceptional condition appropriately.
Displaying the state of execution on the console can be very useful while debugging. However, modern developer tools allow you to put breakpoints and halt execution to inspect a particular value during runtime. You can quickly detect small issues by logging some variable state on the console.
With these concepts, let's see how we can use Chrome Developer Tools to debug JavaScript code.
You can start Chrome DevTools by navigating to menu | More tools | Developer Tools:
Chrome DevTools opens up on the lower pane of your browser and has a bunch of very useful sections:
The Elements panel helps you inspect and monitor the DOM tree and associated style sheet for each of these components.
The Network panel is useful to understand network activity. For example, you can monitor the resources being downloaded over the network in real time.
The most important pane for us is the Sources pane. This pane is where the JavaScript source and debugger are displayed. Let's create a sample HTML with the following content:
<!DOCTYPE html>
<html>
<head>
<meta charset="utf-8">
<title>This test</title>
<script type="text/javascript">
function engageGear(gear){
if(gear==="R"){ console.log ("Reversing");}
if(gear==="D"){ console.log ("Driving");}
if(gear==="N"){ console.log ("Neutral/Parking");}
throw new Error("Invalid Gear State");
}
try
{
engageGear("R"); //Reversing
engageGear("P"); //Invalid Gear State
}
catch(e){
console.log(e.message);
}
</script>
</head>
<body>
</body>
</html>Save this HTML file and open it in Google Chrome. Open DevTools in the browser and you will see the following screen:
This is the view of the Sources panel. You can see the HTML and embedded JavaScript source in this panel. You can see the Console window as well. You can see that the file is executed and output is displayed in the Console.
On the right-hand side, you will see the debugger window:
In the Sources panel, click on the line numbers 8 and 15 to add a breakpoint. The breakpoints allow you to stop the execution of the script at the specified point:
In the debugging pane, you can see all the existing breakpoints:
Now, when you rerun the same page, you will see that the execution stops at the debug point. One very useful technique is to inject code during the debugging phase. While the debugger is running, you can add code in order to help you understand the state of the code better:
This window now has all the action. You can see that the execution is paused on line 15. In the debug window, you can see which breakpoint is being triggered. You can see the Call Stack also. You can resume execution in several ways. The debug command window has a bunch of actions:
You can resume execution (which will execute until the next breakpoint) by clicking on the button. When you do this, the execution continues until the next breakpoint is encountered. In our case, we halt at line 8:
You can observe that the Call Stack window shows you how we arrived at line 8. The Scope panel shows the Local scope where you can see the variables in the scope when the breakpoint was arrived at. You can also step into or step over the next function.
There are other very useful mechanisms to debug and profile your code using Chrome DevTools. I would suggest you to go experiment with the tool and make it a part of your regular development flow.
Runtime exceptions
These errors appear when you execute the code and try to refer to an undefined variable or process a null. When a runtime exception occurs, any code after that particular line (which caused the exception) does not get executed. It is essential to handle such exceptional scenarios correctly in the code. While exception handling can help prevent crashes, they also aid in debugging. You can wrap the code that may encounter a runtime exception in a try{ } block. When any code in this block generates a runtime exception, a corresponding handler captures it. The handler is defined by a catch(exception){} block. Let's clarify this using an example:
try {
var a = doesnotexist; // throws a runtime exception
} catch(e) {
console.log(e.message); //handle the exception
//prints - "doesnotexist is not defined"
}In this example, the var a = doesnotexist; line tries to assign an undefined variable, doesnotexist, to another variable, a. This causes a runtime exception. When we wrap this problematic code in the try{} catch(){} block and when the exception occurs (or is thrown), the execution stops in the try{} block and goes directly to the catch() {} handler. The catch handler is responsible for handling the exceptional scenario. In this case, we are displaying the error message on the console for debugging purposes. You can explicitly throw an exception to trigger an unhandled scenario in the code. Consider the following example:
function engageGear(gear){
if(gear==="R"){ console.log ("Reversing");}
if(gear==="D"){ console.log ("Driving");}
if(gear==="N"){ console.log ("Neutral/Parking");}
throw new Error("Invalid Gear State");
}
try
{
engageGear("R"); //Reversing
engageGear("P"); //Invalid Gear State
}
catch(e){
console.log(e.message);
}In this example, we are handling valid states of a gear shift (R, N, and D), but when we receive an invalid state, we are explicitly throwing an exception clearly stating the reason. When we call the function that we think may throw an exception, we wrap the code in the try{} block and attach a catch(){} handler with it. When the exception is caught by the catch() block, we handle the exceptional condition appropriately.
Displaying the state of execution on the console can be very useful while debugging. However, modern developer tools allow you to put breakpoints and halt execution to inspect a particular value during runtime. You can quickly detect small issues by logging some variable state on the console.
With these concepts, let's see how we can use Chrome Developer Tools to debug JavaScript code.
You can start Chrome DevTools by navigating to menu | More tools | Developer Tools:
Chrome DevTools opens up on the lower pane of your browser and has a bunch of very useful sections:
The Elements panel helps you inspect and monitor the DOM tree and associated style sheet for each of these components.
The Network panel is useful to understand network activity. For example, you can monitor the resources being downloaded over the network in real time.
The most important pane for us is the Sources pane. This pane is where the JavaScript source and debugger are displayed. Let's create a sample HTML with the following content:
<!DOCTYPE html>
<html>
<head>
<meta charset="utf-8">
<title>This test</title>
<script type="text/javascript">
function engageGear(gear){
if(gear==="R"){ console.log ("Reversing");}
if(gear==="D"){ console.log ("Driving");}
if(gear==="N"){ console.log ("Neutral/Parking");}
throw new Error("Invalid Gear State");
}
try
{
engageGear("R"); //Reversing
engageGear("P"); //Invalid Gear State
}
catch(e){
console.log(e.message);
}
</script>
</head>
<body>
</body>
</html>Save this HTML file and open it in Google Chrome. Open DevTools in the browser and you will see the following screen:
This is the view of the Sources panel. You can see the HTML and embedded JavaScript source in this panel. You can see the Console window as well. You can see that the file is executed and output is displayed in the Console.
On the right-hand side, you will see the debugger window:
In the Sources panel, click on the line numbers 8 and 15 to add a breakpoint. The breakpoints allow you to stop the execution of the script at the specified point:
In the debugging pane, you can see all the existing breakpoints:
Now, when you rerun the same page, you will see that the execution stops at the debug point. One very useful technique is to inject code during the debugging phase. While the debugger is running, you can add code in order to help you understand the state of the code better:
This window now has all the action. You can see that the execution is paused on line 15. In the debug window, you can see which breakpoint is being triggered. You can see the Call Stack also. You can resume execution in several ways. The debug command window has a bunch of actions:
You can resume execution (which will execute until the next breakpoint) by clicking on the button. When you do this, the execution continues until the next breakpoint is encountered. In our case, we halt at line 8:
You can observe that the Call Stack window shows you how we arrived at line 8. The Scope panel shows the Local scope where you can see the variables in the scope when the breakpoint was arrived at. You can also step into or step over the next function.
There are other very useful mechanisms to debug and profile your code using Chrome DevTools. I would suggest you to go experiment with the tool and make it a part of your regular development flow.
Console.log and asserts
Displaying the state of execution on the console can be very useful while debugging. However, modern developer tools allow you to put breakpoints and halt execution to inspect a particular value during runtime. You can quickly detect small issues by logging some variable state on the console.
With these concepts, let's see how we can use Chrome Developer Tools to debug JavaScript code.
You can start Chrome DevTools by navigating to menu | More tools | Developer Tools:
Chrome DevTools opens up on the lower pane of your browser and has a bunch of very useful sections:
The Elements panel helps you inspect and monitor the DOM tree and associated style sheet for each of these components.
The Network panel is useful to understand network activity. For example, you can monitor the resources being downloaded over the network in real time.
The most important pane for us is the Sources pane. This pane is where the JavaScript source and debugger are displayed. Let's create a sample HTML with the following content:
<!DOCTYPE html>
<html>
<head>
<meta charset="utf-8">
<title>This test</title>
<script type="text/javascript">
function engageGear(gear){
if(gear==="R"){ console.log ("Reversing");}
if(gear==="D"){ console.log ("Driving");}
if(gear==="N"){ console.log ("Neutral/Parking");}
throw new Error("Invalid Gear State");
}
try
{
engageGear("R"); //Reversing
engageGear("P"); //Invalid Gear State
}
catch(e){
console.log(e.message);
}
</script>
</head>
<body>
</body>
</html>Save this HTML file and open it in Google Chrome. Open DevTools in the browser and you will see the following screen:
This is the view of the Sources panel. You can see the HTML and embedded JavaScript source in this panel. You can see the Console window as well. You can see that the file is executed and output is displayed in the Console.
On the right-hand side, you will see the debugger window:
In the Sources panel, click on the line numbers 8 and 15 to add a breakpoint. The breakpoints allow you to stop the execution of the script at the specified point:
In the debugging pane, you can see all the existing breakpoints:
Now, when you rerun the same page, you will see that the execution stops at the debug point. One very useful technique is to inject code during the debugging phase. While the debugger is running, you can add code in order to help you understand the state of the code better:
This window now has all the action. You can see that the execution is paused on line 15. In the debug window, you can see which breakpoint is being triggered. You can see the Call Stack also. You can resume execution in several ways. The debug command window has a bunch of actions:
You can resume execution (which will execute until the next breakpoint) by clicking on the button. When you do this, the execution continues until the next breakpoint is encountered. In our case, we halt at line 8:
You can observe that the Call Stack window shows you how we arrived at line 8. The Scope panel shows the Local scope where you can see the variables in the scope when the breakpoint was arrived at. You can also step into or step over the next function.
There are other very useful mechanisms to debug and profile your code using Chrome DevTools. I would suggest you to go experiment with the tool and make it a part of your regular development flow.
Chrome DevTools
You can start Chrome DevTools by navigating to menu | More tools | Developer Tools:
Chrome DevTools opens up on the lower pane of your browser and has a bunch of very useful sections:
The Elements panel helps you inspect and monitor the DOM tree and associated style sheet for each of these components.
The Network panel is useful to understand network activity. For example, you can monitor the resources being downloaded over the network in real time.
The most important pane for us is the Sources pane. This pane is where the JavaScript source and debugger are displayed. Let's create a sample HTML with the following content:
<!DOCTYPE html>
<html>
<head>
<meta charset="utf-8">
<title>This test</title>
<script type="text/javascript">
function engageGear(gear){
if(gear==="R"){ console.log ("Reversing");}
if(gear==="D"){ console.log ("Driving");}
if(gear==="N"){ console.log ("Neutral/Parking");}
throw new Error("Invalid Gear State");
}
try
{
engageGear("R"); //Reversing
engageGear("P"); //Invalid Gear State
}
catch(e){
console.log(e.message);
}
</script>
</head>
<body>
</body>
</html>Save this HTML file and open it in Google Chrome. Open DevTools in the browser and you will see the following screen:
This is the view of the Sources panel. You can see the HTML and embedded JavaScript source in this panel. You can see the Console window as well. You can see that the file is executed and output is displayed in the Console.
On the right-hand side, you will see the debugger window:
In the Sources panel, click on the line numbers 8 and 15 to add a breakpoint. The breakpoints allow you to stop the execution of the script at the specified point:
In the debugging pane, you can see all the existing breakpoints:
Now, when you rerun the same page, you will see that the execution stops at the debug point. One very useful technique is to inject code during the debugging phase. While the debugger is running, you can add code in order to help you understand the state of the code better:
This window now has all the action. You can see that the execution is paused on line 15. In the debug window, you can see which breakpoint is being triggered. You can see the Call Stack also. You can resume execution in several ways. The debug command window has a bunch of actions:
You can resume execution (which will execute until the next breakpoint) by clicking on the button. When you do this, the execution continues until the next breakpoint is encountered. In our case, we halt at line 8:
You can observe that the Call Stack window shows you how we arrived at line 8. The Scope panel shows the Local scope where you can see the variables in the scope when the breakpoint was arrived at. You can also step into or step over the next function.
There are other very useful mechanisms to debug and profile your code using Chrome DevTools. I would suggest you to go experiment with the tool and make it a part of your regular development flow.
Both the testing and debugging phases are essential to developing robust JavaScript code. TDD and BDD are approaches closely associated with the agile methodology and are widely embraced by the JavaScript developer community. In this chapter, we reviewed the best practices around TDD and usage of Jasmine as the testing framework. We saw various methods of debugging JavaScript using Chrome DevTools. In the next chapter, we will explore the new and exciting world of ES6, DOM manipulation, and cross-browser strategies.