Book Image

Learn QGIS - Fourth Edition

By : Andrew Cutts, Anita Graser
Book Image

Learn QGIS - Fourth Edition

By: Andrew Cutts, Anita Graser

Overview of this book

QGIS 3.4 is the first LTR (long term release) of QGIS version 3. This is a giant leap forward for the project with tons of new features and impactful changes. Learn QGIS is fully updated for QGIS 3.4, covering its processing engine update, Python 3 de-facto coding environment, and the GeoPackage format. This book will help you get started on your QGIS journey, guiding you to develop your own processing pathway. You will explore the user interface, loading your data, editing, and then creating data. QGIS often surprises new users with its mapping capabilities; you will discover how easily you can style and create your first map. But that’s not all! In the final part of the book, you’ll learn about spatial analysis and the powerful tools in QGIS, and conclude by looking at Python processing options. By the end of the book, you will have become proficient in geospatial analysis using QGIS and Python.
Table of Contents (8 chapters)

Introducing the QGIS user interface

Now that we have set up QGIS, let's get accustomed to the interface. The following screenshot shows a breakdown of QGIS. The main part of the screen is dominated by the map display, which can be adjusted as needed.

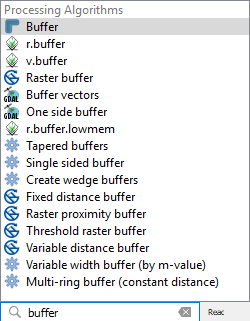
The Processing Toolbox can be added by clicking View | Panels | Processing Toolbox:
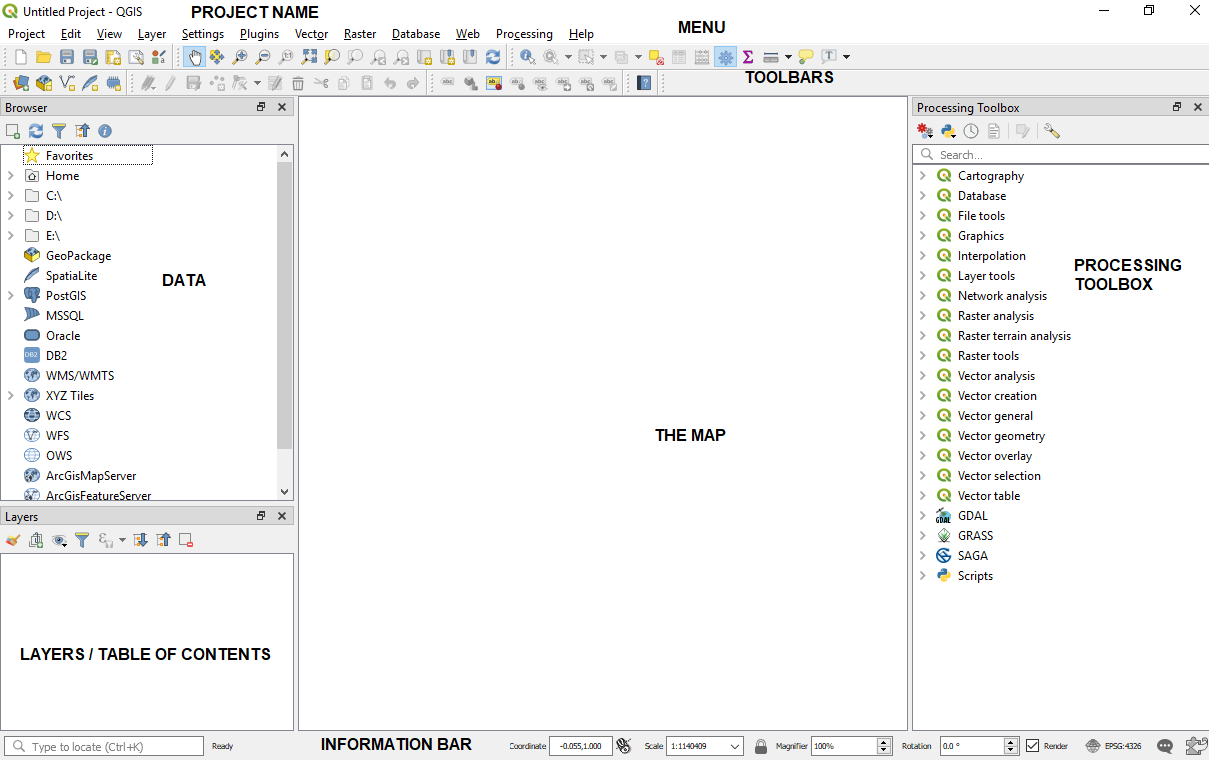

Overview of QGIS

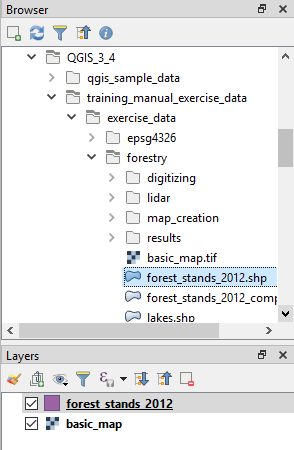
The biggest area is reserved for the map. To the left of the map, there are the Layers and Browser panels. Under the map, we can see the information bar, which includes (from left to right):

  • Search box
  • The current map Coordinate
  • Map scale
  • Magnifier
  • Rotation
  • A checkbox for render
  • The project coordinate reference system (CRS)
  • Messages (logs)
  • Updates available for plugins

In this screenshot, EPSG:4326 is shown. On the right side is the Processing Toolbox, which also has a search function. Finally, at the top of QGIS, you can see the project title (as yet unnamed), menus, and toolbars.

Menu bar

Options in the menu bar are frequently repeated in buttons contained in the toolbars. As you explore these menus, you will notice icons next to some of the options. These shortcut buttons on toolbars often become the easiest way to interact with QGIS. The following is a screenshot of the menu bar:

Menu bar

The Vector and Raster menus are worth exploring, and we will do this in Chapter 5, Spatial Analysis. You will often find that new plugins insert additional options within these menus or even create new menus. As we move through this book, we will often refer to the menu bar by just the name of the menu. For example, Database | DB Manager means click on Database menu and then the DB Manager option within that menu.

Toolbars

There are multiple toolbars to explore; let's take a look at some of the main ones. Toolbars are fully adjustable and dockable. The faint upright dots (in Windows) indicate the start of a toolbar and a faint vertical line indicates the end of a toolbar.

  • Project: This toolbar contains the tools needed to create, open, save, and access the print layout (two buttons) and the style manger:
Project toolbar
  • Map Navigation: This toolbar contains the pan and zoom tools, as well as bookmarks (customized zoom) and map refresh:
Map Navigation
  • Attributes: These tools are used to identify, select, open attribute tables, and measure:
Attribute toolbar
  • Label: These tools are used to add, configure, and modify labels
  • Plugins: This currently only contains the Python Console tool, but will be filled in by additional Python plugins
  • Database: Currently, this toolbar only contains DB Manager
  • Raster: This toolbar includes histogram stretch, and brightness and contrast control
  • Vector: This currently only contains the Coordinate Capture tool, but it will be filled in by additional Python plugins
  • Web: This is currently empty, but it will also be filled in by additional Python plugins
  • Help: This toolbar points to the option for downloading the user manual

All these toolbars are shown in the following screenshot:

Many of the common tools grouped together

On the left screen border, we place the Manage Layers toolbar. This toolbar contains the tools for adding layers from the vector or raster files, databases, web services, and text files. It also contains the tools for creating new layers:

Manage layers toolbar
  • Digitizing: The tools in this toolbar enable basic feature-creation and editing.
  • Shape Digitizing: Useful for quickly building different shapes when editing.
  • Advanced Digitizing: This toolbar contains the Undo/Redo option, advanced editing tools, the geometry-simplification tool, and so on. When activated, the right part of the screenshot is accessible:
All the editing tools
  • The data source manager toolbar contains buttons to quickly create new geopackage files and shapefiles, as well as calling the data source manager and creating temporary scratch layers:
Data source manager toolbar

Toolbars can be accessed by right-clicking on a menu or toolbar, which will open a context menu with all the available toolbars and panels. All the tools on the toolbars can also be accessed via the menu. If you deactivate the Manage Layers Toolbar, for example, you will still be able to add layers using the Layer menu.

As you might have guessed by now, QGIS is highly customizable. You can increase your productivity by assigning shortcuts to the tools you use regularly. You can do this by going to Settings | Configure Shortcuts. Similarly, if you realize that you never use a certain toolbar button or menu entry, you can hide it by going to Settings | Interface Customization:

Customization of the user interface

Information bar

The information bar is useful for finding out about the projection and navigation of the map. The information bar also contains icons about any log messages (potential errors) and any plugins with updates pending. It is shown in the following screenshot, and is located at the bottom of the QGIS window:

Information bar

The search function is one of the new features in QGIS 3 and this helps to find processing tools or layers. You can use the shortcut keys shown in the following screenshot:

Using the shortcut keys

Alternatively, you can search directly for what you are looking for. For example, you can simply search for a buffer in the information bar search and the results will be similar to the following screenshot:

Searching for buffer tools

Layers and browser panels

Browser and Layers panels describe where data is stored and how that data is displayed. Now is a great time to download some sample data. Head over to https://qgis.org/downloads/data/ and download training_manual_execise_data.zip. Extract it in a folder of your choice and then navigate to that folder in the Browser window.

I have located the basic_map.tif and forest_stands_2012.shp files and dragged them both into the Layers window. We will look at styling layers in Chapter 3, Visualizing Data, and then cover how to create a map in Chapter 4, Creating Great Maps.Lets take a look at Browser and Layers Panels in the following screenshot:

Browser and Layers Panels

Map

Now that we have added some data to the Layers window, the data will appear in the map. The following screenshot shows two layers that I have added to the map: one vector (forest_stands_2012) and one raster (basic_map):

QGIS with some data added

The data has appeared! Notice that the projection in the information bar has changed; QGIS 3 supports on-the-fly projections. Finally, we have to save the project.The new default format is .qgz. Select Project | Save, and the window shown in the following screenshot will appear:

Saving a QGIS project

If you now click Project | New, you should see your saved project in the Browser window:

How the project appears in the Browser window

To load the project again, double-click on the project name.

You can sometimes open QGIS 2.x projects in QGIS 3, but you cannot open QGIS 3 projects in QGIS 2.x, so be careful.