-
Book Overview & Buying
-
Table Of Contents

Oracle JRockit: The Definitive Guide
By :
Oracle JRockit: The Definitive Guide
By:
Overview of this book
Oracle JRockit is one of the industry’s highest performing Java Virtual Machines. Java developers are always on the lookout for better ways to analyze application behavior and gain performance. As we all know, this is not as easy as it looks. Welcome to JRockit: The Definitive Guide.This book helps you gain in-depth knowledge of Java from the JVM’s point of view. We will explain how to write code that works well with the JVM to gain performance and scalability. Starting with the inner workings of the JRockit JVM and finishing with a thorough walkthrough of the tools in the JRockit Mission Control suite, this book is for anyone who wants to know more about how the JVM executes your Java application and how to profile for better performance.
Table of Contents (23 chapters)
Oracle JRockit

Credits
Foreword
About the Authors
Acknowledgement
About the Reviewers
Preface
 Free Chapter
Getting Started
Adaptive Code Generation
Adaptive Memory Management
Threads and Synchronization
Benchmarking and Tuning
JRockit Mission Control
The Management Console
The Runtime Analyzer
The Flight Recorder
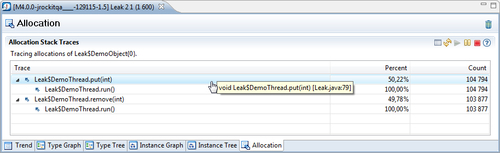
The Memory Leak Detector
Using the JRockit Management APIs
JRockit Virtual Edition
Bibliography
Glossary
Index