-
Book Overview & Buying
-
Table Of Contents

Microsoft Dynamics CRM 2011 Reporting
By :
Microsoft Dynamics CRM 2011 Reporting
By:
Overview of this book
All of the data entered into a CRM means nothing if it is unable to report the important information to our managers and executives in such a way that they can easily and quickly get the results they need. A better reporting system would enable them to make the necessary improvements to the processes that any business needs in a dynamic business world.For users and developers wishing to take advantage of using the report capabilities of Dynamics CRM, this is the book for you.
Microsoft Dynamics CRM 2011 Reporting is a practical and excellent reference guide that provides you with a number of different options you can use to create and empower the Reporting capabilities of Dynamics CRM. This will give you a good grounding in using the reports in your Dynamics CRM 2011 implementations.
This book looks at all the different options we can use to create reports in Dynamics CRM 2011, starting with SQL Reporting Services and custom reports, created in either CRM Report Wizard, SQL Report Builder, or Visual Studio. It will also show other options we can use such as dashboards, charts, and different ways to optimize and automate reports.We will also learn how to build our own reports either using the different wizards for basic reports or using Visual Studio for more complex reports. We will explore the options mobile CRM users have who want to run and see reports on these mobile devices.
Table of Contents (13 chapters)
Preface

 Free Chapter
1. Introduction to Reporting in Microsoft Dynamics CRM
2. Database Basics
3. Creating Your First Report in CRM
4. SQL Server Report Builder
5. Creating Contextual Reports
6. Creating Inline Reports
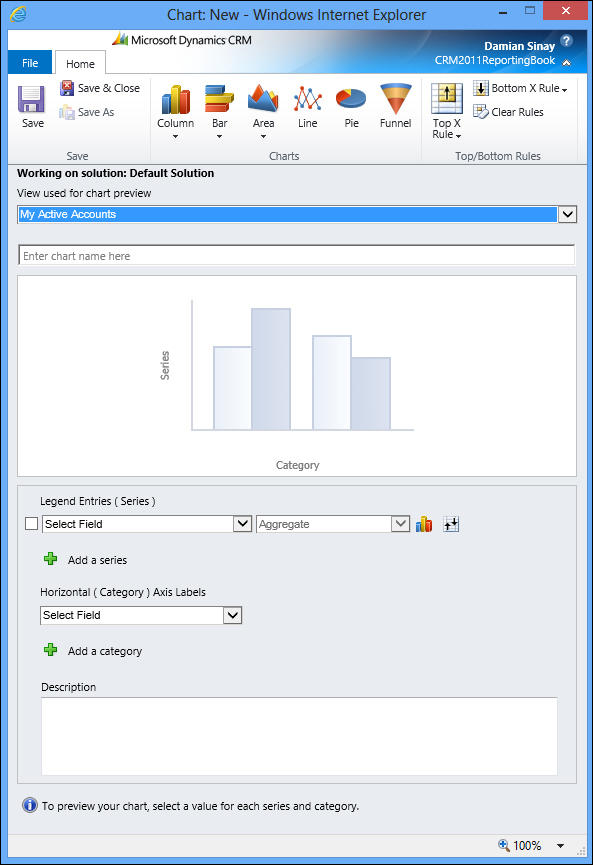
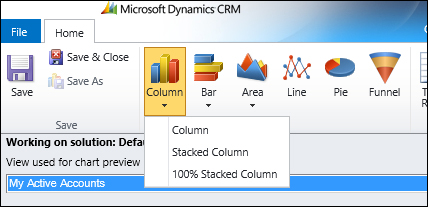
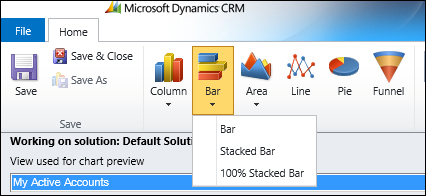
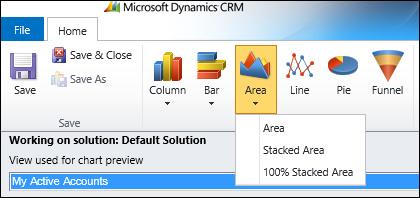
7. Using Reports and Charts in Dashboard
8. Advance Custom Reporting and Automation
9. Failure Recovery and Best Practices
10. Mobile Client
A. Expression Snippets
Index