-
Book Overview & Buying

-
Table Of Contents

ASP.NET Site Performance Secrets
By :


ASP.NET Site Performance Secrets
By:
Overview of this book
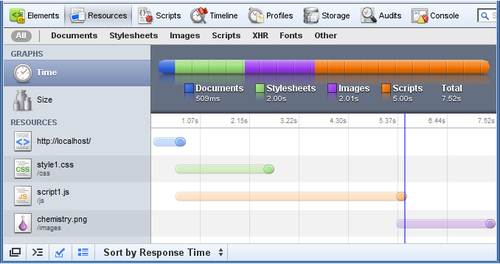
Do you think that only experts with a deep understanding of the inner workings of ASP.NET, SQL Server, and IIS can improve a website's performance? Think again – because this book tosses that notion out of the window. It will help you resolve every web developer's nightmare – a slow website – with angry managers looking over your shoulder, raging calls from advertisers and clients – the lot. You don't have the time or energy to gain a thorough and complete understanding of ASP.NET performance optimization – You just need your site to run faster! This book will show you how.This hands-on book shows how to dramatically improve the performance of your ASP.NET-based website straight away, without forcing you through a lot of theoretical learning. It teaches you practical, step-by-step techniques that you can use right away to make your site faster with just the right amount of theory you need to make sense of it all.Start reading today and you could have a faster website tomorrow.Unlike other performance-related books, here you'll first learn how to pinpoint the bottlenecks that hold back your site's performance, so you can initially focus your time and energy on those areas of your site where you can quickly make the biggest difference. It then shows you how to fix the bottlenecks you found with lots of working code samples and practical advice, and just the right amount of theoretical detail.The first chapter details techniques for diagnosing performance issues using Waterfall charts. Subsequent chapters then each focus on one individual aspect of your website, providing you with numerous real-life scenarios and performance-enhancing techniques for each of them. In the last chapter, you learn how to effectively load-test your environment in order to measure the change in performance of your site without having to update your production environment – whether it is a new release or simply a small change in the database.
Table of Contents (19 chapters)
ASP.NET Site Performance Secrets


Credits
About the Author
About the Reviewers
Preface
 Free Chapter
High Level Diagnosis

Reducing Time to First Byte
Memory
CPU
Caching
Thread Usage
Reducing Long Wait Times
Speeding up Database Access
Reducing Time to Last Byte
Compression
Optimizing Forms
Reducing Image Load Times
Improving JavaScript Loading