
Performing a basic risk assessment
In this section, we're going to briefly cover how we might calculate a risk score in practical terms by utilizing the previously mentioned formula of Risk = Impact x Likelihood. By covering this now, we'll be able to dive deeper into this topic in Chapter 2, Protecting the Security of Assets, and be able to answer questions such as the following:
"Which mitigating controls do we have in place to protect our organization's three most valuable assets?"
However, from the perspective of what we've covered so far, we simply aren't ready to delve deeper into the topic of how we might implement an Information Security Management System (ISMS) into our organization. With that being said, we will be, by the end of the next chapter! Until then, it's worth covering how we can assess risk in a very simplified fashion.
Let's imagine that you've been hired as an information security officer for The Ketchup Company. Your crown-jewel asset at The Ketchup Company is your secret recipe for ketchup. Consider that The Ketchup Company's top competitor (who sells absolutely terrible ketchup) somehow manages to gain access to your organization's secret recipe and steal it for themselves. What would the impact of that happening be? What is the likelihood of that being possible?
We know that risk is the combined impact and likelihood of a threat exploiting a vulnerability. By understanding our assets, their vulnerabilities, and the threats they may face, we can begin to calculate the risk.
Just for this example, I can tell you now that The Ketchup Company's ketchup recipe is stored on the organization's network attached storage (NAS), which is accessible from the outside world by visiting the domain "http://networkstorage.theketchupcompany.com" through a web browser, with no username or password required for access. Furthermore, I can say that our top competitor being able to access the secret ketchup recipe would cost The Ketchup Company over 5% of its annual revenue per year.
First of all, I'd like to take this opportunity to add two assets to our asset register at The Ketchup Company, like so:

Okay; some basic housekeeping is in order. Now, let's use this example scenario to perform a basic risk assessment, and practically cover some of the concepts we've gone into so far.
Defining and calculating impact
In order to calculate risk, we need to define the way your organization sees the various levels of impact that it could potentially face as a result of a security event. These values will depend on your organization and should be discussed with the appropriate stakeholders, who have a detailed understanding of its finances and operations.
For a simple starter, try this:
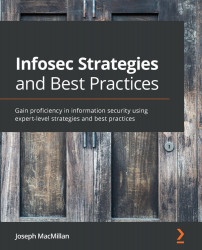
The organization losing 5% or more of its annual revenue due a security event is considered "catastrophic," while 3%-5% is "high," 1%-3% is "medium," 0%-1% is "low," and under $300 is "negligible."
Using those definitions, we can create an impact definition table, like so:

This is a considerably basic and immature example of how we might go about defining the potential impact of a security event occurring. Percentage of revenue might not be the best measure, so you can always consider defined sum ranges, or percentage of net income, and so on. It's not necessarily perfect, but this example lets us dip our toe into risk management, to set the scene for expanding various risk-based topics in rest of this book.
Defining and calculating likelihood
Next, in order to understand likelihood, we must define the way our organization sees various levels of likelihood. Is one occurrence per year a high level of likelihood, or a low level of likelihood for your organization?
For a simple starter, try this example:
A likelihood score of 5 is defined as "once per year or more," a score of 1 is "once every 10 or more years," and the years in-between get 2, 3, and 4.
Refer to the following table for an example of a likelihood definition table:

With that, we've successfully defined the way we score likelihood for The Ketchup Company. Remember, it's up to you to determine the best way to define impact and likelihood at your organization, but again, as we've said, this is just to set the scene for expanding various risk-based topics in the rest of this book.
Calculating risk
Now, we can go back to our example, where we will try to determine the likelihood and impact scores of a competitor accessing The Ketchup Company's secret recipe for ketchup. Using the details I provided earlier, we know that the recipe is stored on the company's NAS, and that this NAS can be reached from the outside world. Actually, we know that anybody who visits the domain "http://networkstorage.theketchupcompany.com" in their browser can access the recipe, without any username or password requirements, and we know that a competitor being able to access this recipe would cost the company over 5% of its annual revenue.
First, let's determine this example's impact. Referring to the table that we created for our impact definitions, we can see that a 5% loss of annual revenue would mean the impact score related to that event is "5," or "Catastrophic."
I've included the table for illustration purposes here:
Now that the impact score has been determined, the next step would be to determine the likelihood of that event occurring. One way you might try to determine likelihood is through historical records. You might ask the following questions to stakeholders at your organization:
- Has this event happened before?
- How often has it happened?
- When was the last time it happened?
Sometimes, there is no historical data available, if your organization hasn't previously kept a record of breaches or information security events, or they haven't had the adequate level of visibility to know if an event has occurred.
Sometimes, your organization gains a new asset with new vulnerabilities, or maybe new threats arise, and therefore new risks arise as well.
In these cases, it's important to investigate and understand the implications of assets, their threats, their vulnerabilities, and the impact and likelihood of various risk events. We will be doing this as often as necessary to understand the risks the organization faces.
Let's look at our example system. Essentially, accessing the recipe can be done from a web browser. The URL for accessing the recipe could easily be shared outside the organization for anybody to see. Additionally, it might be able to be found via Google search results, or an automated system finding the networkstorage subdomain for our theketchupcompany.com domain. No username or password is required for anyone to access the recipe.
In this circumstance, let's say that we consider our threat actor's motivation (in this circumstance, a competitor with absolutely terrible ketchup) and capability (it has been previously rumored they've stolen their mustard recipe from The Mustard Company). With that information, we can determine that with the current configuration, and the current lack of any security controls to protect the recipe from unauthorized access, our competitor is likely to find the recipe within the next year.
If we refer to the likelihood definition table we created earlier and consider the information surrounding likelihood we provided previously, we can determine that the likelihood score associated with this specific example is a "5."
See the following table for a reminder:

So, we now have both an impact score and a likelihood score for our example. Next, we must calculate the risk. Before we do that, it is worth showing a visual representation of the risk score, based on varying levels of impact and likelihood. If we were to illustrate the previously mentioned formula of Risk = Impact x Likelihood as a risk matrix, we would see something similar to the following:
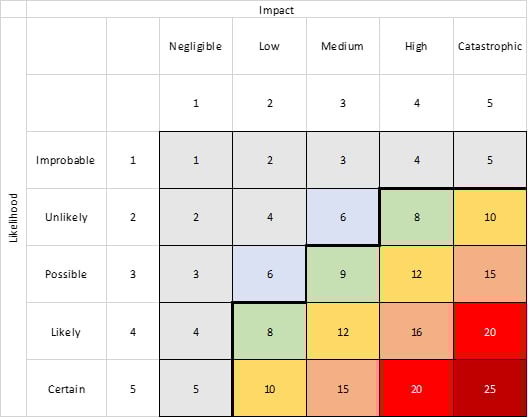
Figure 1.2 – Risk matrix
- The x axis represents impact, including the numerical "score" associated with each of the defined levels of impact from our previous table.
- The y axis represents likelihood, including the numerical "score" associated with each of the defined levels of likelihood from our previous table.
- By multiplying a number from the impact axis with a number from the likelihood axis, you get a risk score. In this case, it ranges from 1 to 25.
This is a common way of illustrating the risk formula we've mentioned several times in this chapter, as it helps visualize the incremental increase in the level of risk based on the various levels of impact and likelihood.
If we were to perform the calculation for our example, where we determined the impact of the event to be a score of "5" and the likelihood of the event to be a score of "5," how would we do that? Yes – it's as simple as multiplying "5" by "5," in order to arrive at a risk score of "25."
Okay, but now what do we do? Is that level of risk okay? Is it unacceptable? Let's look into the next steps.
Risk appetite, risk treatment, and risk acceptance
It's up to your organization's stakeholders to determine the acceptable level of risk, which is also referred to as the organization's risk appetite.
Obviously, we are going to want to appropriately define our impact and likelihood to reflect the risk appetite of the organization. If a risk is determined to have the highest score possible, as with our example, but the stakeholders don't seem to mind, this means that their definitions of impact and likelihood aren't being reflected appropriately in our tables defining each.
One more thing we might notice in the risk matrix diagram is the dark black line that separates the risk scores above "7" from the others. This is the risk appetite or risk acceptance level being represented visually on the risk matrix. In this circumstance, the organization's stakeholders have decided that any risk with a risk score above "7" is considered unacceptable, and requires further risk treatment.
Risk treatment is the way we select controls to modify the risk level. We can "avoid," "reduce," "transfer," and "accept" risk. Let's take a look:
- Risk avoidance is achieved by removing the likelihood of the risk entirely, generally by not performing any of the actions that would lead to the risk.
- Risk reduction is performed by reducing either the impact or likelihood levels, generally through mitigating controls.
- Risk transfer is done by shifting all or part of the risk to a third party, through outsourcing and insurance, for example.
- Risk acceptance occurs once the organization acknowledges that a risk doesn't require further mitigation, or it is unfeasible to mitigate the risk further.
Mitigating controls are the methods by which we try to protect each asset from threats. They can include all kinds of methods and tools, but if we continue using the example of The Ketchup Company's ketchup recipe being accessible over the web, a form of risk reduction could be to implement a mitigating control that requires a password in order to access the secret recipe.
Once that mitigating control is implemented, your residual risk is the risk level after the mitigating control is applied, because the mitigating control has modified the risk by reducing the likelihood of the threat being able to access the recipe.
Once the residual risk has been reduced below the risk acceptance level, we can consider the residual risk level to be acceptable, and therefore we achieve risk acceptance.
Let's consider further vulnerabilities, such as the following:
- A flawed password entry page
- A weak password, "
hunter2" - A direct link to the recipe that doesn't require us to log in
We will need to calculate risk scores for each of these to understand the risk facing the organization. To document the various risks, we can create a risk register for the organization. By doing so, we will be building out the organization's ISMS. Doesn't that sound like the most fun you've ever had?
Like we said at the start of this section, we will delve deeper into how to go about structuring both an asset register and a risk register in Chapter 2, Protecting the Security of Assets. For now, it makes sense to move on and discuss another concept that is going to prove to be useful for the next chapter: the various legal regulations and compliance requirements facing an information security professional.