

When we provision the CPU resources, which is the number of vCPUs allocated to running the virtual machines and that is greater than the number of physical cores on a host, is called CPU overcommitment.
CPU overcommitment is a normal practice in many situations; however, you need to monitor it closely. It increases the consolidation ratio.
CPU overcommitment is not recommended in order to satisfy or guarantee the workload of a tier-1 application with a tight SLA. CPU overcommitment may be successfully leveraged to highly consolidate and reduce the power consumption of light workloads on modern, multi-core systems.
To step through this recipe, you need a running ESXi Server, a couple of running CPU-hungry virtual machines, a SSH client (Putty), vCenter Server, and a working installation of vSphere Client. No other prerequisites are required.
The following table elaborates on Esxtop CPU Performance Metrics:
|
Esxtop Metric |
Description |
Implication |
|---|---|---|
|
%RDY |
Percentage of time a vCPU in a run queue is waiting for the CPU scheduler to let it run on a physical CPU. |
A high %RDY time (use 20 percent as a starting point) may indicate the virtual machine is under resource contention. Monitor this; if the application speed is ok, a higher threshold may be tolerated. |
|
%USED |
Percentage of possible CPU processing cycles which were actually used for work during this time interval. |
The %USED value alone does not necessarily indicate that the CPUs are overcommitted. However high %RDY values, plus high %USED values, are a sure indicator that your CPU resources are overcommitted. |
To spot CPU overcommitment there are a few CPU resource parameters which you should monitor closely. Those are:
Log in to the ESXi Server through the SSH client.
Type
esxtopand hit enter.Monitor the preceding values to understand CPU overcommitment.

This example uses esxtop to detect CPU overcommitment. Looking at the pCPU line near the top of the screen, you can determine that this host's two CPUs are 100 percent utilized. Four active virtual machines are shown, Res-Hungry-1 to Res-Hungry-4. These virtual machines are active because they have relatively high values in the %USED column. The values in the %USED column alone do not necessarily indicate that the CPUs are overcommitted. In the %RDY column, you see that the three active virtual machines have relatively high values. High %RDY values, plus high %USED values, are a sure indicator that your CPU resources are overcommitted.
From the CPU view, navigate to a VM and press the E key to expand the view. It will give a detailed vCPU view for the VM. This is important because at a quick level, CPU ready as a metric is best referenced when looking at performance concerns more broadly than a specific VM. If there is high ready percentage noted, contention could be an issue, particularly if other VMs show high utilization when more vCPUs than physical cores are present. In that case, other VMs could be leading to high ready time on a low idle VM. So, long story short, if the CPU ready time is high on VMs on a host, it's time to verify that no other VMs are seeing performance issues.
You can also use vCenter performance chart to spot the CPU overcommitment, as follows:
Log in to the vCenter Server using vSphere Client.
On the home screen, navigate to Hosts and Clusters.
Go to the ESXi host.
Click on the Performance tab.
Navigate to the CPU from the Switch To drop-down menu on the right-hand side.
Navigate to the Advanced tab and click on the Chart Options.
Navigate to the ESXi host in the Objects section.
Select only Used and Ready in the Counters section and click on OK.

Now you will see the ready time and the used time in the graph and you can spot the overcommitment. The following screenshot is an example output:
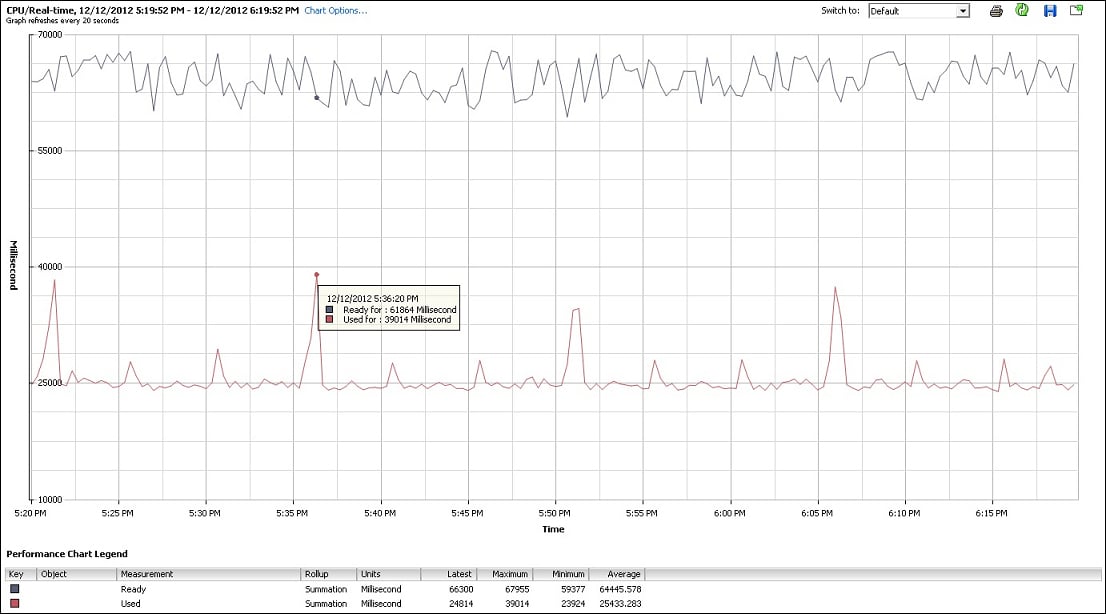
The following example shows that the host has high used time.
Although high ready time typically signifies a CPU contention, the condition does not always warrant corrective action. If the value for ready time is also accompanied by high used time then it might signify that the host is overcommitted.
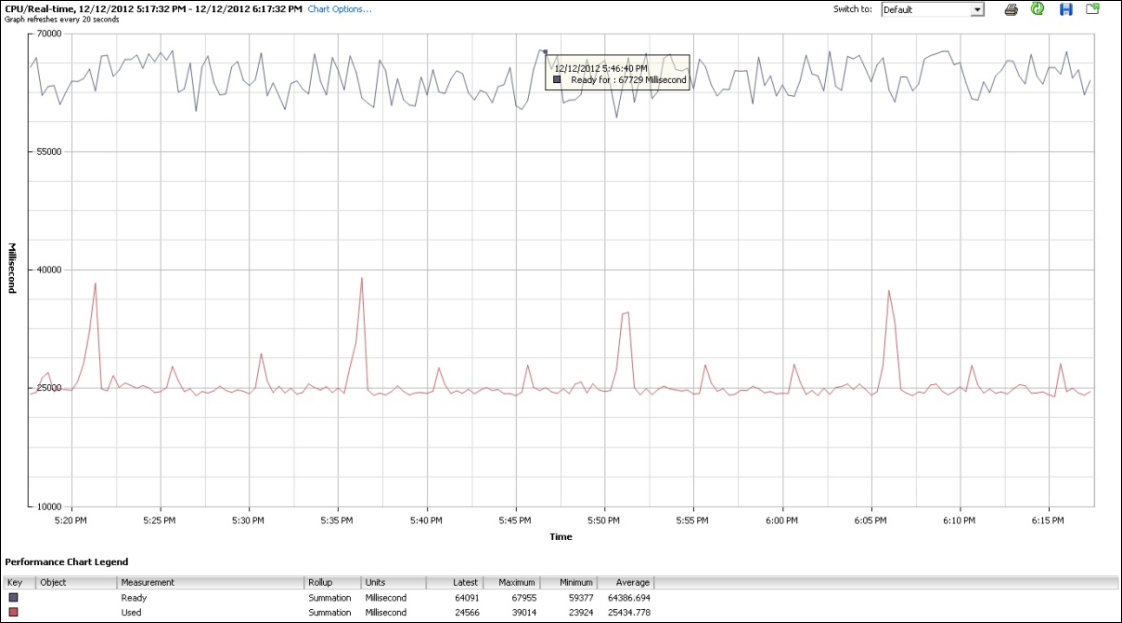
So used time and ready time for an host might signal contention. However, the host might not be over-committed, due to workload availability.
There might be periods of activity and periods that are idle. So the CPU is not over-committed all the time. Another very common source of high ready time for VMs, even when pCPU utilization is low, is due to storage being slow. A vCPU, which occupies a pCPU, can issue a storage I/O and then sits in the WAIT state on the pCPU blocking other vCPUs. Other vCPUs accumulate ready time; this vCPU and this pCPU accumulate wait time (which is not a part of the used or utilized time).