

Up until now, everything I’ve covered has been an introduction to Meteor; this is where it starts to get interesting. In this section, we will be building a complete Meteor app, with all the key features in mind.
The project we are going to build is a mind-graphing program for planning other projects. So, by the end of the book, you will not only have the Meteor expertise needed to build your own apps, but you will also have a really cool planning tool to help you design them.
If you’re not sure what I’m talking about when I say mind-graphing, then the following image should clarify this a bit:
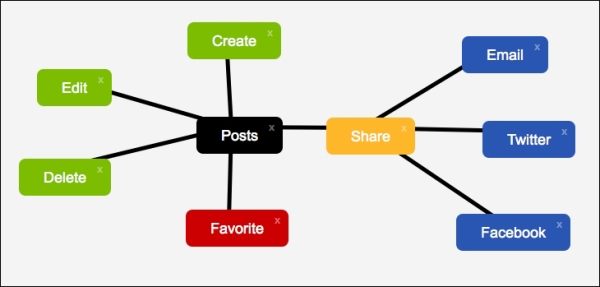
Basically it’s an application where you create nodes, which represent ideas, and you can connect nodes together to show how they are related. It’s a great tool for brainstorming, and a great project for getting started with Meteor.
Now the first aspect to building any project is always planning, so we should begin there.
When building applications people often skip over the planning stage, and I’m not talking about theoretical planning, such as when you think about what you are going to make. I am talking about concrete function and data planning. The worst thing you can do when you are starting a new project is jump right into the programming part.
Planning is what makes the difference between a programming veteran and a complete beginner. There are only a very finite number of code words you can put in your program. A language such as JavaScript can be memorized in less then a day, but at the same time it could take years to become a pro.
When creating a program, only about 20 percent of your work should have to do with actual programming. This may sound counter-intuitive, but with the proper planning techniques you will not only be able to code the app in a fraction of the time, but the app will be cleaner, more secure, and also it will follow all the best practices.
But before we get into the specifics of planning, let’s talk about some of the mistakes people starting out usually make, so that we will know what to watch out for. The first mistake is the one that I have already mentioned, and that is to start programming without doing the proper planning. So what’s the big deal with doing this?
Well for one, you’re basically winging it, and at the first hiccup you will pivot your idea in order to work around a problem and when this happens enough, your application ends up losing features. Also, because you have no idea what functions will end up being in your code, you have to constantly switch back and forth between files, which can dramatically lower your productivity. Finally, your code will lack any sort of best practices or code reusability, but how could it? You can’t write functions for code you don’t know will exist. I hope this makes it clear that starting a project by coding is a bad idea.
The next pitfall most people take is that they don’t re-use code. And I don’t mean that people forget to use snippets; what I mean is that people often rewrite similar functions twice, when they should abstract most of it, and just implement the difference. The reasons for doing this are twofold: first of all it saves on code and makes you more productive, but an even better reason is the fact that if you ever need to update your app down the line, you only need to do it once (we already kind of talked about this when we discussed separation of concerns). The variations in a function should only be concerned with their variations, not with the base implementation.
The third most common flaw I see being done is starting with the design first. When you code like that you end up with a lot of behavioral code rather than solid independent code. For example, instead of having a function that calculates a value, you just make a click event and jam the code in there. Yes, it might only be a short couple of lines, but it is a couple of lines you’ll have to rewrite next time.
With that said, I have created a planning process in order to try and rectify all the problems just discussed, among others that I personally have had to deal with. The process consists of making up five simple plans, each one tackling a different area of difficulty. What you will find is that once we finish making the plans the actual programming will feel obvious, and will take a fraction of the time (depending on your typing speed). Not only that, but what if I told you that the five plans have no skill-requirements? That’s right, you don’t need to be an expert programmer to create these. All you need is a basic understanding of website usage, a pen, and some paper.
Let’s begin with the first plan, and that is the feature plan.
The feature plan: This is the most basic of the five, but at the same time it’s the basis of the other four. In this plan you simply write (on paper, not in your head) what you want your application to do, and remember to include everything.
That means you should write things such as “ability to sign up/log in”, this may sound obvious and hardly like a feature. But it is important, not really for the sake of this plan but it will be needed in the other ones.
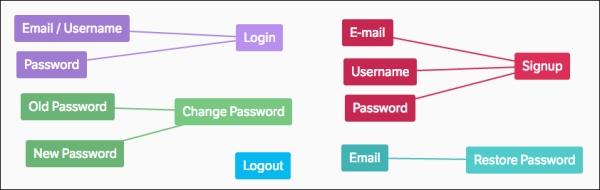
Here is the plan I wrote out for our app; take a look at the kind of things I’ve put in:
Users need to be able to sign up/log in/change their password and restore it by e-mail if they ever forget it
Users will be able to create and delete graphs as well as rename them
We need the ability to select a graph and view its nodes
The user has to be able to create and delete nodes, as well as change the text/color and move the nodes around
Last but not least, the user has to be able to connect nodes to show relationships
It’s a pretty simple paragraph to write up, but the important part is that you have it on paper, and notice that no technical skills were required for this.
The next plan on the list that has to be made is the data plan.
The data plan: So why is the data plan next? Because we can’t start planning out functions if we don’t know what data we have available. Notice the difference between going straight into programming rather than planning everything out. When you jump right in, your code dictates the data, here we plan the data first and then we plan the code. This assures us we are only storing the minimum and there are no superfluous pieces of info which will bog down your application. As a rule of thumb, it is much easier to scale code than it is to scale data.
Now when I say “data plan”, I do not mean a database plan nor do I mean a variables plan, or anything like that. What I am talking about is purely what pieces of info we need to create the description from the feature plan; you don’t even need to be a programmer to write this out.
Let’s begin with the user’s object. From the description we will need a username, an e-mail address and a password, that’s it. Notice I didn’t write an address or full name, as it wasn’t needed according to the description.
Next, we have the graph object to plan out. Here we need a name and an owner, nothing too crazy just the essentials.
After the graphs, we have the individual nodes. From the description we will need: some text, the color, the position, and finally the graph that the node belongs to.
Last but not least, we talked about relationships; these will need just the two nodes it has to connect.
So, with all that info compiled, you could draw the following diagram:

The next plan we have to make is the object plan.
The object plan: The third plan in my process is to make an object plan. Basically, you graph out all the functions and you split them according to components. I know this must sound really technical, but I assure you, all you need to do is separate each “feature” from our original description into its own function and group the features together according to the topic. Chances are that just by how people write sentences, the features are already split up into components; in our example pretty much each sentence is talking about a different component.
I split our features into the same four objects we made in the data plan. This is coincidental, and it does often happen, but it isn’t required. You can have more or fewer objects in the data plan than in the object plan.
Here is the diagram of all the components:

Some might say that this step is almost blatantly obvious from the description and is superfluous. But as much as I would want to have a four-step planning process, I urge you to write this plan out. By writing it, you are committing to a design. So, yes, this is a minor practical issue, but by committing you no longer have to deal with it when programming.
Now let’s go to the fourth plan.
The pages plan: The pages plan is exactly what it sounds like; you draw the different pages, again on paper not with HTML/CSS. I cannot tell you how many hours I wasted fidgeting with the CSS to look just right, all because it wasn’t planned out. By doing it on paper, there are no settings. You just draw what you want and you’re done!
Now this step isn’t just to haphazardly go crazy on paper. In a good web design, there is a concept that everything on the page has a purpose (the confusion stems from the fact that a “coolness enhancement” feature can be considered a purpose). So when you are drawing your pages, make sure to tie in all the features you wrote out from the previous step.
For example, we had a function to create a new node, so make some kind of button for this. We also had a function to signup, so make up some kind of widget for it.
This step is probably the most time-consuming, as you have to find a place for everything, but it can still easily be done in less than 20 minutes.
I will now walk you through the pages I came up with:
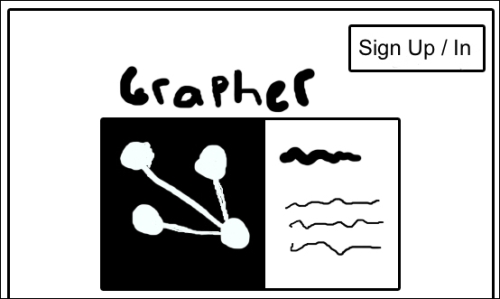
The front page: On this page, you can see the user controls to sign in/sign up, and in the middle of the page there is some static content describing the site:
The graphs page: On the graphs page, you can see the buttons to add, open, and delete graphs as well as the Logout button. Notice that to rename a graph you double-click the title; because I can’t really draw a “double tap”, I just wrote it out. It may not be a graphical property but it’s definitely considered part of UX:

The nodes page: This page contains the bulk of the operations. On the top, you can see the button to add a new node; you have the name of the current graph, the color options, a button to go back, and the same Logout button from before.
In the middle is where the nodes will go and each node has its text plus a Delete button. The events I added are as follows:
Clicking and dragging on a node will move it
Double-clicking on a node’s text allows you to change it
Clicking a node’s outer ring allows you to create new relationships
Finally, double-clicking on a relationship line will delete it
This is the kind of thing I was looking for when I said plan out the pages, so with the pages now planned we can move on to the final step.

The reconciliation plan: Besides being a mouthful, the reconciliation plan is the step where you take all the info from the previous plans and write out some concrete facts about all the functions. Namely you have to write what parameters the function will accept, and what data a function will return, if anything at all.
Functions are like closed machines; they have inputs and outputs and that’s all you need to know, everything else is irrelevant. Think about your coffee machine; you put in water and coffee beans and you get out a cup of coffee. It doesn’t really matter how, for all we care. It could be creating the coffee using some ancient fairytale magic. All I have to know is what to put inside in order to get my coffee out.
Let’s start with the user’s object. I took all the functions we wrote it should have from step three and wrote out their details based on the other plans:
Again everything I wrote is derived from the plans we already made. That is the beauty of this process; everything is out on the table!
Here’s the same plan, but for the graphs object:

Then we have the actual nodes:

And finally we have the graph for the relationships object:

We have now planned out all the aspects of our program. At this point you should have a pretty good idea of how we are going to implement it, and how the different features will work. Notice how none of the functions had any output. Normally I would add boxes to the right of each function to show the output. But if you remember, in Meteor you usually don’t update the screen manually; you update the data and Meteor will take care of the rest, so there is no need to return anything as once the function changes the data you will see the change automatically.
You can take a moment to review the plans if you are still unclear about something, but after that we can move onto the building part. It’s worth noting that these plans are not set in stone; if you come up with something later on you can change things around, but it is important to go back and run it through. So, for example, if you add a feature, you should go through all the steps, and if you only update a page you should go through stages four and five.
Being an MVVM framework, the first step when coding a Meteor application is always the data. We haven’t yet talked about Meteor’s default database, so now sounds like a good time to do so. This isn’t a book on MongoDB, so I’m not going to go into MongoDB’s more advanced features, but a basic understanding of noSQL databases, and MongoDB in particular , is important.
Relational databases such as MySQL or any of the other popular SQL databases, store their data in tables. You create a table by defining the different columns your data needs, and then you can insert rows of data that conform to your table. The power of a database system, such as this, comes from how you relate columns from one table to columns in another (that’s where the term “relational” comes from).
Databases such as MongoDB, on the other hand, store their data in documents instead of table rows, and instead of tables the groups of documents are called collections. But there are bigger differences than just the names; a table row has to follow the specific schema enforced by the table. A document in MongoDB is just a JSON object. This works out perfectly, as you are already programming in JavaScript, so storing your data in JavaScript objects keeps things simple.
But wait, there’s more! Because each document can contain whatever you want (that is they don’t follow a schema like in a table), there is no setup. You don’t need to declare the column names, because there are no columns. In order to create a database with MongoDB, you just use it. This is incredibly useful when you’re prototyping, as you can just swap your data structure on the fly.
MongoDB does have a lot of good things going for it, but coming from a relational-database background you will potentially have two problems, the first is that the open-endedness can be overwhelming and easy to abuse. If you think about it, a JSON object could potentially have infinite levels of nested data; we can store our whole app in a single document by just nesting all the other data, such as users and graphs into sub arrays. The other issue is the radically different API. MongoDB doesn’t use a query language such as SQL; it has a JavaScript library with functions such as find or update in order to get things done. I can’t do much about the first problem, it’s a matter of experience—trial and error if you will. All I can say is try not to abuse it. But for the second issue, I can easily show you all the commands you’ll need for most apps.
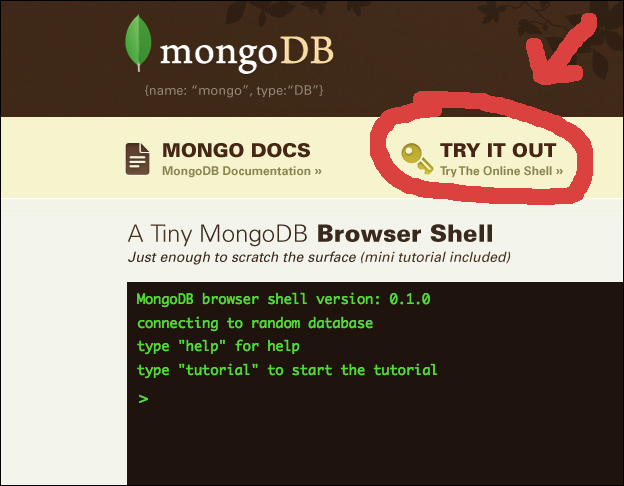
I’m going to go through all the basics, and if you want to try the functions out, I would recommend going to mongodb.org. On the front page, you will find a button labeled Try It Out. This will open up a console window right on the home page, allowing you to test out all the commands. I’m about to show you without installing anything:
Your other option is to create a new Meteor app and start it by running the meteor command, and then with the app running you can open a second terminal navigated to the same directory and run meteor mongo to open up the MongoDB shell.
Let’s begin with how to insert rows. To insert a row in MongoDB, you use the insert command. Like I mentioned, there is no schemas to set up or databases to initialize. So in one of the MongoDB shells, type in the following:
db.test.insert({“name”: “Gabriel”, “framework”: “Meteor”});This command will insert a document into the collection named test with the specified information. To view the newly inserted data, just run:
db.test.find();
Since we aren’t passing any parameters in to find, we are basically saying “find all the documents”. If we insert another row or two, we can test out more advanced calls to find:
db.test.insert({“name”: “John”, “framework”: “Laravel”, “age” : 43});
db.test.insert({“name”: “Peter”, “framework”: “Rails”});
You can clearly see in the preceding example, that in one of the documents I added a field called age. I didn’t need to set anything up, nor did I have to modify the old rows, because MongoDB doesn’t really care what your storing, it just saves the JSON object into the collection.
Now that we have three rows, we can do some more advanced find requests:
db.test.find();
db.test.find({“name”: “Gabriel”});
db.test.find({“name” : { $ne : “Gabriel” }});
The first command is the same as before, and it should return all the three rows. The second command selects all rows where the name equals Gabriel, which in our case is only one row. The last command takes it one step further; it finds all rows where the name doesn’t equal Gabriel ($ne stands for not equals). You will see this convention come up a lot with MongoDB, where you specify a separate JSON object as the value, with the key starting with a dollar sign. You have ones such as $gt for greater than or $lt for less than, these are just a couple but when we get to updating rows you will find a few more.
To update a row, you start with the same parameters as find, but you add a second parameter with the new JSON data. Here is an example of a simple update query:
db.test.update({“name” : “John”}, {“name”: “Jack”});This seems simple enough, but if you run a find query now, you will see that we lost all the rest of John’s (or maybe Jack’s) information. This is because a standard update will replace the current JSON document in the collection with the new one. In order to update a property while keeping the old info, you have to use the $set keyword:
db.test.update({“name” : “Peter”}, {$set : {“name” : “Pendle”}});This time the name will change but the other data, namely Pendle’s framework, will remain.
The last function I want to discuss is the remove function, it takes exactly the same parameters as the find command, but instead of returning the results, it will delete the documents:
db.test.remove({“name”: “Jack”});Running find now should only return the two remaining rows.
This has been a brief intro to MongoDB and, of course, there are more advanced queries than the ones I covered. But for most apps, these features should be all you will need.
So with this out of the way we can begin creating our graphing application.
To get started, open a terminal window and navigate to the meteorApps folder we created in the Quick start – creating your first application section:
cd ~/meteorApps
Then run the meteor create command in order to set up our new app:
meteor create grapher
cd grapher
Now in the Quick start section, we just used the default files that are provided by Meteor, but here we are going to want to manage our files a bit better. You will soon see that I didn’t choose the graphing application just because it was easy, but rather because it brings up a lot of the problems you can have while using Meteor. Hopefully, by covering all the edge cases here, you will be able to build (almost) anything.
An important thing to know is how Meteor loads its resources to the client, which will help you structure your app and make sure objects have the necessary dependencies loaded.
To start off with, there are four folders that you can create at the root of your Meteor app, to gain special benefits:
client: Theclientfolder is—as its name suggests—the place where you should put all JS files that are meant for the client. You may remember from the Quick start section, we had to enclose what we wanted to run on the client in anifstatement, checking that we were in fact on the client. That was because all JS files are run on both the client and the server, all of them except the ones in theclientfolder, which only get run on the client.public: If you create a folder namedpublicat the root of your project, than any files inside will be publicly available from your app. This is where things such as images should go.server: This folder works the same way as theclientfolder, except that files in here are only run on the server, and are never even passed to the client. If you have any credentials, or special “secret” code which you don’t want available on the client, then you can put it here.lib: Lastly, there’s thelibfolder, which is the place for adding your JS files that you need loaded first. The order in which files get loaded are as follows; first thelibfolder gets read, from the inside out. This means sub-directories get loaded before parent directories, and the order in directories that files get loaded is alphabetical, except for files namedmain.js. If a file is namedmain.js, it gets loaded after everything else. After thelibfolder is done, Meteor continues to the rest of the files, excluding theclientfolder on the server, and theserverfolder on the client. The rest of the folders follow the same rules as thelibfolder, so nested directories first, alphabetically loaded, andmain.jsfiles come last.
All CSS files are compiled together and loaded only on the client, and HTML files have two processes. All body and head sections are combined and loaded to the client, and any template sections are converted to JavaScript and sent appropriately.
With this info, let’s split up our app to use a Meteor-compliant folder structure. First off, in the root of our project we should have a global file where we can put stuff that is needed on both the server and client. To create it, just type:
touch global.js
Next, we will make the four special folders I just talked about; you don’t need to include any of them in your app but for the sake of demonstration we will create them all:
mkdir client lib server public
Besides those folders, let’s create a folder for HTML templates:
mkdir html
Now, for the files we will need one file in the lib folder; if you remember, this is where we will put stuff that have to be loaded first:
touch lib/grapher.js
We only have three pages, so in the html folder let’s put one file for each:
touch html/graphs.html html/home.html html/nodes.html
On the server, we only need one file for the Model part of the MVVM architecture:
touch server/model.js
And last but not least, we have to create all the files that go in the client directory:
cd client
touch graphs.js nodes.js relationships.js users.js \
model.js main.js
It’s one file per object as we planned, as well as a file to communicate with the server’s Model, and a file called main.js, which we know will be run last. The last thing we can do is delete the standard JS file that Meteor created:
rm ../grapher.js
Your complete file tree should look something like the following:
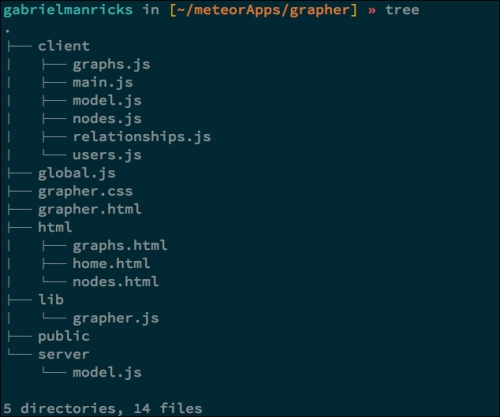
With the files ready, let’s talk about another one of Meteor’s features—Smart Packages.
Meteor comes installed with a host of packages that you can plug right into your application. To view them all, just type:
meteor list
This will show you all the packages as well as a short description about what they do. Right off the bat, you can see they have an accounts package, which actually works quite well, so we can use that instead of implementing our users class. Besides that, I will be using jQuery and the d3 library. I don’t think jQuery needs any introductions, and d3 is a library for drawing graphics (it does some other things but we will be using the drawing functionality). So to add these packages, type:
meteor add accounts-ui accounts-password jquery d3
The accounts-ui package provides some HTML formatting for all the user forms. Next, the accounts-password package is a package for allowing people to sign up using a password. This is in contrast to their other account packages, which allow users to log in with Twitter, and so on.
So, we just installed some Smart Packages, but what exactly are they? A Smart Package is a JavaScript application that hooks into Meteor in one way or another. Meteor basically provides hooks for functions to run at different stages throughout its process, and these packages can be injected to provide custom functionality.
Currently, the API is not fully written or ready for people to build their own, but the Meteor team is working on it, and when it’s ready you will be able to code self-contained components, much like what they did with the accounts package, allowing you to re-use a lot of your code throughout your different applications.
We are (finally) going to start coding, so if you want to leave the terminal, you can just type meteor to run the server. You won’t have to come back here! One of the features Meteor offers is that it will monitor changes to the files and automatically update the web pages for you, without even needing to reload the page. This is another of the productivity-boosting features that will speed up your workflow.
Let’s begin by filling out the global.js file. This file will be the place for all the code that has to be run on both the client and the server. We are going to put the variables for the MongoDB collections here, as these are going to be used on both the client and server. So open global.js and enter the following:
GraphsModel = new Meteor.Collection(“Graphs”);
NodesModel = new Meteor.Collection(“Nodes”);
RelationshipsModel = new Meteor.Collection(“Relationships”);
These variables now contain the collection objects from MongoDB. These variables are essentially the same as db.collection that we used before. So instead of db.Graphs.find(), you would now type GraphsModel.find().
Next, we can start implementing the objects we worked so hard to plan out. Open up the grapher.js file that’s inside the lib folder. If you recall, this is the file that will be loaded first, and as such it’s the perfect place for adding a scope variable. Scoping your variables is pretty important; if you’re working on a big project you could overwrite global variables, or some of Meteor’s function names may conflict with yours. To avoid this whole situation, all we need to do is add our own private variable to attach everything else to. So inside the grapher.js file, enter the following code:
var Grapher = {};That’s all it takes! This one line provides us with a variable to attach all our custom objects to. Let’s put this into practice by creating the first of our objects—the graphs object. When I’m creating the objects, I like to have the reconciliation plans out, so that I can see right away what methods need to be implemented and what parameters each function accepts. So without further ado, enter the following inside of the graphs.js file, which is in the client folder:
Grapher.Graphs = {
    create : function(name, owner){
        GraphsModel.insert({
            “name”  : name,
            “owner” : owner
        });
    },
    rename : function(graph, new_name){
        GraphsModel.update({“_id” : graph},{
            $set : {“name” : new_name}
        });
    },
    delete : function(graph){
        GraphsModel.remove({“_id” : graph});
    },
    change_current : function(graph){
        Session.set(“current_graph”, graph);
    }
};
We had four functions in the plan so I just wrote them out—same names, same parameters. This means if you forget how to call your objects, just take a look at the plans, and you will get the answer. The create function accepts a name and an owner as parameters, and it uses MongoDB’s insert command to add a new document. The rename function takes the ID of a graph as well as the new name, and it updates the specified graph’s old name using the update and set methods we covered previously. Next, we have the delete method, which accepts a graph’s ID and removes the specified graph, again using standard MongoDB functions. You see, all it took was a page or two for you to master all the MongoDB needed to build apps.
The final property here is the change_current function, which sets the current graph. This uses Meteor’s Session object, which is basically just a key-value store where you can set and retrieve values by name.
Now onto the next object, the nodes object. Save the graphs.js file we’ve been working on, and open the nodes.js file, which is in the same folder (the client folder). Inside the node.js file, we have to write the exact same kind of thing that we wrote for the graphs:
Grapher.Nodes = {
    create : function(text, color, position, graph){
        NodesModel.insert({
            “text”      : text,
            “color”     : color,
            “position”  : position,
            “graph”     : graph
        });
    },
    delete : function(node){
        NodesModel.remove({“_id” : node});
    },
    move : function(node, new_position){
        NodesModel.update({“_id” : node}, {
            $set : {“position” : new_position}
        });
    },
    change_text : function(node, new_text){
        NodesModel.update({“_id” : node}, {
            $set : {“text” : new_text}
        });
    },
    change_color : function(node, new_color){
        NodesModel.update({“_id” : node}, {
            $set : {“color” : new_color}
        });
    }
};
We assign a new object to our Grapher scope variable, and then we just create the same create and delete functions as in the graphs object. By the graphs object, we only had one parameter to update—the name. Here we have three, so there is one function for each, and they are: position, text, and color. I can easily say that there is no new logic here, and it’s really just an interface to the model.
Finally, we have to create the relationships object. Open the relationships.js file and write the following code snippet:
Grapher.Relationships = {
    create : function(node_a, node_b){
        RelationshipsModel.insert({
            “node_a” : node_a,
            “node_b” : node_b
        });
    },
    delete : function(relationship){
        RelationshipsModel.remove({“_id” : relationship});
    }
};
Since there are no properties to change in the relationships object, all we have is the create and delete functions, again built according to the reconciliation plan.
Now, I said we will be using the accounts Smart Package for handling users, so why did I make a user.js file? The answer is because there are some settings to tweak the account-ui package’s usage, and it wouldn’t really be relevant anywhere else. To find out how the package works and what kinds of settings you have available, it’s as simple as opening http://docs.meteor.com and just reading about it there. But for those who aren’t that interested, and trust that I did my research, you could just place the following inside the users.js file:
Accounts.ui.config({
    passwordSignupFields : ‘USERNAME_AND_EMAIL’
});
What this tells Meteor is that we want to request and store both the username and e-mail of the user signing up, as apposed to the default which just stores the e-mail. Now with our objects having been implemented, we can begin creating the pages.
Let’s start with the bare HTML template. Open up the grapher.html file that is at the root of your application and erase everything inside. Since our application will be distributed among multiple files, the actual scaffolding is rather simple. Remember, Meteor will combine all body and head tags it finds and send them to the client. The entire file is as follows:
<head>
    <title>Grapher</title>
</head>

<body>
    {{> grapher}}
</body>

<template name=”grapher”>
    {{#if logged_in}}
        {{#if graph_selected}}
            {{> nodes_page}}
        {{else}}
            {{> graphs_page}}
        {{/if}}
    {{else}}
        {{> home_page}}
    {{/if}}
</template>
Most of this we have covered already, but I’ll go through it for the sake of review. The head section is self-explanatory, just the title. Then we get to the body section, where we just have a simple call to a template named grapher. Lastly, we have the actual grapher template that we referenced, and we put three options inside. If the user is not logged in, we get the home page. If the user is logged in, but no graph is selected, then we get the graphs page (the page where you can select a graph). Finally, if the user is logged in and we do have a graph selected, we will get the page with all the nodes. Doing it this way means no paging in your app; the URL bar will always stay the same and the pages will change instantly. Instead of page-changing events, we are relying on the facts, asking “what needs to get done” in order to display a page. This creates a much more accurate model of a site.
In this script, I used a lot of variable placeholders such as logged_in or graph_selected, but from where am I getting these, and how can you create your own? Well, the answer to this is that there are no variables. All of these are completely made up and that’s the beauty of Meteor—you basically do whatever you want and make it work later. You may have realized by now, but that was the whole point of the planning stages. To look at what’s available all the time cages creativity as well as productivity. Working with the correct order allows you to basically do whatever you want. By doing the templates first, we write it in an as natural method as possible and then we create the code for it when we are ready.
Let’s open up the main.js file that is in the client folder. In here we have to define what these two placeholders do. Unsurprisingly, a combination of our planning plus Meteor’s design makes this very simple:
Template.grapher.logged_in = function(){
    return Meteor.user();
};
Template.grapher.graph_selected = function(){
    return Session.get(“current_graph”);
};
The accounts Smart Package gives us a function named user under the Meteor namespace, which will return either the currently logged-in user’s ID or null if no one is signed in. Since the template files evaluate based on falsy values, null is considered false which will fail the if statement.
The second function works in exactly the same principle, if nothing was assigned through Session under the provided key, Meteor will return undefined, thereby failing the second if statement. The current_graph key is the one that will be set by our Graphs object, so this just checks if that function has been assigned a graph yet or not.
Now whip out your page plans, because it’s page-making time! Let’s begin by creating the home page. Open up the home.html file and enter the following:
<template name=”home_page”>
    <div id=”login_bar”>
        {{loginButtons  align=”right”}}
    </div>
    <div class=”main_container”>
        <h1>Grapher</h1>
        <div class=”content”>
            <div id=”home_image”>
                <img src=”home.png”>
            </div>
            <div id=”home_description”>
                <h2>What’s Grapher?</h2>

                <p>Lorem ipsum ….</p>
            </div>
        </div>
    </div>
</template>
The template’s name is home_page as that is what we defined in the scaffolding; next we have the call to loginButtons wrapped in a div tag. The div tag is for styling purposes and the loginButtons call is provided by the accounts-ui Smart Package. The align right property tells the accounts-ui package that we will be placing it on the right-hand side of the page, and to style its forms appropriately. The call to loginButtons and the knowledge about its properties were both found on the docs.meteor.com page I mentioned earlier.
The rest of the page is just static content as per the home page’s page plan. It’s the title, an image, and some text. You could probably load the page up in your browser but we haven’t styled anything yet so it wouldn’t look too neat. I don’t think this book is meant to explain CSS in particular, so as we create objects I will show you the CSS but I won’t really go into it in detail, as it’s a personal preference anyway. All you have to do is add it to the grapher.css file in the root of your project. Here is the base CSS I am using as well as the CSS specific to the home page:
body{
    font-family: arial;
    background: #F4F4F4;
}
#login_bar{
    position: fixed;
    padding: 20px 30px 0px 0px;
    right: 0px;
    top: 0px;
}
.main_container{
    width:900px;
    margin: auto;
    margin-top: 100px;
}

.content{ background: #FFF; }
.title_link{
    font-size: 15px;
    vertical-align: 4px;
}
a{
    text-decoration: none;
    color: #436690;
}
h1{
    font-size: 65px;
    text-align: center;
}
h3{
    font-size: 35px;
    display: inline;
}
h4, h5{
    margin-bottom: 10px;
    display: inline-block;
    padding-left: 13px;
}
h4{
    font-size: 23px;
    vertical-align: -2px;
}
#home_image{
    display: inline-block;
    width: 500px;
    vertical-align: top;
}
#home_description{
    display: inline-block;
    width: 340px;
    padding: 20px;
}
Now create and place an image called home.png in the public folder, and navigate your browser to http://localhost:3000. If Meteor is still running, you should get the following:
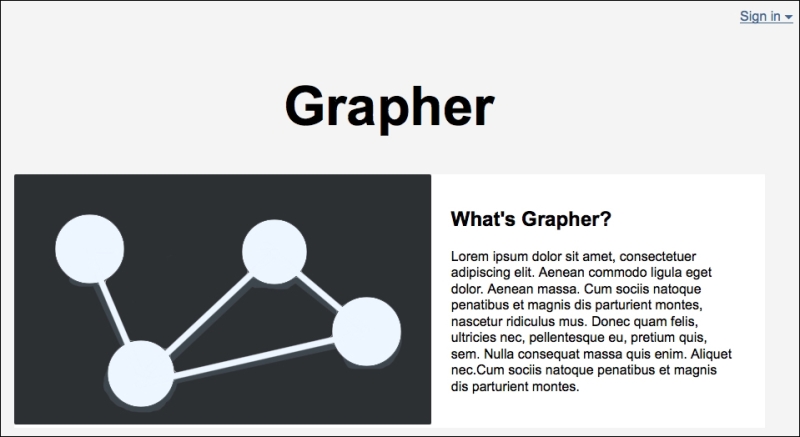
It does somewhat resemble the picture I drew for the plan, so that’s good. Now you can try the users form, but the second you sign up you will be shown a blank screen. That is because Meteor is bypassing the home page (due to the fact you are signed in) but it can’t load the graphs page, as it isn’t built yet.
So let’s build the graphs page. This page is slightly more complicated than the home page, but still pretty simple in the scheme of things. Here is the main template for the page (put this in graphs.html):
<template name=”graphs_page”>
    <div id=”login_bar”>
        {{loginButtons  align=”right”}}
    </div>
    <div class=”main_container”>
        <h1>Grapher</h1>
        <div class=”content” id=”graph_content”>
            <div id=”graphs_header”>
                <h3>Graphs</h3>
                <span class=”title_link”>
                    - <a href=”#” id=”new_graph”> Add a Graph</a>
                </span>
            </div>
            {{#if has_graphs}}
                <table id=”graphs”>
                    <thead>
                        <tr>
                            <th></th>
                            <th class=”button_col”></th>
                            <th class=”button_col”></th>
                        </tr>
                    </thead>
                    <tbody>
                        {{#each graphs}}
                            {{> graph_row}}
                        {{/each}}
                    </tbody>
                </table>
            {{else}}
                <p>You currently have no graphs!</p>
            {{/if}}
        </div>
    </div>
</template>
It looks long at first glance, but when you read it, it’s mostly standard HTML. We start off with the same login bar and login widget, only here it will allow you to log out instead. Next, we have the same exact container and title as on the homepage, so, so far so good.
Then, we have the header word Graphs with the add button. The way events work in Meteor is as follows: you assign a class or ID in the template, and then you create an event map which is basically just a list of handler strings with functions attached. It may sound a little confusing from my description but when you see it, you will understand right away.
After the title we have an if statement which checks if we have any graphs or not. If we do, it will load them in a table, otherwise it will display the message You currently have no graphs!. Inside the table, you can see a for each loop, which cycles through all the graphs and runs a template partial for each one named graph_row. Let’s add that template to the bottom of the graphs.html file:
<template name=”graph_row”>
    <tr>
        <td><span class=”graph_title”>{{name}}</span></td>
        <td class=”button_col”><a class=”open_graph” href=”#”>Open</a></td>
        <td class=”button_col”><a class=”delete_graph” href=”#”>Delete</a></td>
    </tr>
</template>
This template is the code for inserting a single row into our table, and as you saw we call this template from a for each loop, so we will get one row per graph. It’s worth noting that when you call any variables or functions from inside an each loop, the context changes from the current template's context to the object’s context. This allows you to call private properties of the individual rows, as we do here for things such as the name. You can view this in your browser, but again a little CSS would help, so add the following CSS to your grapher.css file:
#graph_content{ padding: 30px; }
#graphs_header{
    width: 840px;
    height: 50px;
    border-bottom: 1px solid #828282;
    margin-bottom: 30px;
}
#graphs{ width: 100%; }
.button_col{
    width:100px;
    text-align: right;
}
.graph_title{
    font-size: 19px;
    line-height: 50px;
}
The page is now up, but no functionality has been coded (you can try clicking on things if you want); the only thing that will work is the Logout button as it was provided by the Smart Package. In order to get this page fully operational, we need to add a couple of definitions to our main.js file (it’s inside the client folder):
Template.graphs_page.has_graphs = function(){
    return GraphsModel.find({}).count();
}
Template.graphs_page.graphs = function(){
    return GraphsModel.find({});
}
The first definition is for the has_graphs if statement, where we decide whether to show the table or the “no graphs” message. It’s a similar idea to what we did in the scaffold, except instead of returning null when there aren’t any graphs, the MongoDB collection would still return a cursor object (just one with no rows). So we instead return the count and since zero is a falsy value, it will trigger the if statement. The second function is the one called when it cycles through the different graphs. Because MongoDB returns standard JavaScript objects, which the templates can handle natively, no processing is required and we can pass the data straight through.
The last thing needed to get this page up and running is the event-map I talked about. The event-map is a JavaScript object, which contains all the event functions and their target handles. I’ll show you the complete graph’s event-map and then I’ll go through it one at a time (this should also go in the main.js file):
Template.graphs_page.events({
    ‘click #new_graph’ : function(){
        Grapher.Graphs.create(“New Graph (double click to rename)”, Meteor.userId());
    },
    ‘dblclick .graph_title’ : function(){
        var new_name = prompt(“Please enter the new name:”, this.name);
        if(new_name){
            Grapher.Graphs.rename(this._id, new_name);
        }
    },
    ‘click .delete_graph’ : function(){
        if(confirm(“Are you sure you want to remove ‘” + this.name + “’”))
        {
            Grapher.Graphs.delete(this._id);
        }
    },
    ‘click .open_graph’ : function(){
        Grapher.Graphs.change_current(this);
    }
});
As you can probably see, it uses a very jQuery-like syntax for event names and the same CSS DOM selectors (that means a period for a class and a # symbol for IDs). The first defined event is for the New Graph button. Since we have already set up our graph object, we can call the create function with a default name, and the currently logged-in user, and then our object will insert it for us. The next event is when someone double-clicks on a graph’s title, denoted by the class name. This function has two steps; first we are generating a prompt where the user can enter a new name, and unless the user clicks cancel (filtered out by the if statement) we will call our graph object’s rename function to rename it. But how are we able to call Meteor.name or Meteor._id to get the objects info, if the event is running on the DOM element as apposed to the data itself? This is another “magic” feature offered by Meteor. Meteor always tries its best to match up an HTML element with its data; it does this by reading the context that was usedto create it, and like I said, when you are in an forEach loop, the context switches to the data object.
If not for this, you would need to manually add custom attributes and do some tricky filtering. Out of all Meteor’s features—and there are a lot of them—this one has got to be one of the most helpful. Back to the event-map, the next function is the delete graph function. Here we open a confirm window using standard JavaScript, and if the user confirms we call the delete method on our graphs object. Last but not least, we have the open function, which calls the remaining function—the change_current function—in our graphs object. Again, because the current context is the graph data itself, we can just pass this.
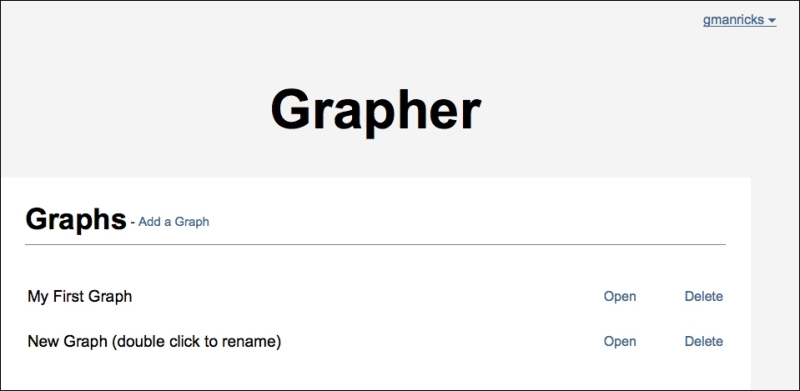
Now going back to your browser, you are able to not only log in and out, (thereby switching between the home page and the graphs page), but you should be able to add, remove, rename, and open graphs at will. Just don’t open any, as we haven’t created the nodes page yet.
If the nodes page is getting its own header, then you know there are going to be some special issues we will need to fix, but I’m getting ahead of myself. Let’s continue in the same way we have up to now, and write the basic layout first. Open up nodes.html from the html folder and insert the following:
<template name=”nodes_page”>
    {{> node_section}}
    <div id=”header”>
        <div id=”login_bar”>
            {{loginButtons  align=”right”}}
        </div>
        <h3>Grapher</h3>
            <span class=”title_link”>
                - <a href=”#” id=”go_back”> Go Back to Graphs</a>
            </span>
        <div id=”graph_main_title”>
            <h2>{{graph_name}}</h2>
        </div>
        <h4><a href=”#” id=”new_node”>New Node</a></h4>
        <h5>Colors: </h5>
        <div class=”color_box red” color=”red”></div>
        <div class=”color_box blue” color=”blue”></div>
        <div class=”color_box orange” color=”orange”></div>
        <div class=”color_box green” color=”green”></div>
        <div class=”color_box black” color=”black”></div>
    </div>
</template>
To keep things simple, I separated out the node stuff into its own template partial named node_section. If you take a look at the page plan, you will see that there is a toolbar-typed box at the top with all the info and controls, that is the header div tag, which you can see near the top. Inside you have the same login/logout form as before and then we have the title; this time it’s a third-level header instead of an H1 level. Next, there is a button to go back to the previous page, named and labeled appropriately. Then we have the actual name for the currently displayed graph, and finally we have the New Node button and the boxes to change a node’s color. This should all match what we have in the node page’s plan. Next, let’s take a look at the node_section template, which I separated out:
<template name=”node_section”>
    <div id=”node_area”>
        {{#each nodes}}
            {{> node}}
        {{/each}}
        {{#constant}}
        <svg id=”relationships”>
            <line id=”mouse_line” />
        </svg>
         {{/constant}}
    </div>
</template>
This template begins by cycling through all the nodes, calling a template named node for each node. You should be seeing a pattern when working with Meteor. Next, we have a new tag, the constant tag, and inside that we have a standard HTML SVG section where we are going to draw all the relationship lines. There is one line included and that is the element we will be using to draw the temporary line we make while creating a relationship. If you think about it, all the stored relationships can be loaded from the relationships database, but the one that you are making hasn’t been stored yet, so in order to draw it on screen we will manually be drawing it using this line object. So what’s that constant tag? Basically in a nutshell, constant sections prevent Meteor from reloading elements inside. You probably know by now that Meteor doesn’t reload the page, it reloads sections of the page. This is fine for 90 percent of cases, but sometimes you need the elements on a page to stay put. For example, if you have something selected in JavaScript and you don’t want the node to change on you, or in our case SVG areas have a hard time being tampered with by Meteor. So to avoid all the errors associated with this behavior, I wrapped it in the constant tags. It basically means Meteor won’t refresh it, and it’s up to you to manually update that section.
Last but not least, let’s take a look at the template partial named node:
<template name=”node”>
    <div id=”{{_id}}” class=”node_border” style=”top:{{position.y}}px; left:{{position.x}}px;”>
        <div class=”node {{color}} {{selected}}”>
            <span class=”node_text”>{{text}}</span>
            <span class=”remove_node”>x</span>
        </div>
    </div>
</template>
This template will be called once for each node, and what it does is create a single div tag to represent the said node. There are a couple of key attributes that make this all work. First of all, we set the id attribute of the div tag to the actual node’s ID from the database; this is so that we can easily select it later. Next, we hardcode the div tag’s position with the node’s values and open the actual node’s inner tag. Here we can see the following two properties:
The
selectedpropertyThe
colorproperty
You can learn two things about the app from here. First off, the color attribute in the node’s database represents a CSS class and secondly we will be applying a class to show when a node gets selected. Lastly, we set the text and the Remove button.
That’s the entire HTML out of the way, let’s now write the final CSS into the grapher.css file and then it’s JavaScript until the end:
#header{
    height: 180px;
    position: fixed;
    top: 0px;
    left: 0px;
    width: 100%;
    background: #FFF;
    border-bottom: 4px solid #828282;
    padding-bottom: 0;
}
.red{ background: #CC0000; }
.blue{ background: #2956B2; }
.green{ background: #7DBD00; }
.orange{ background: #FEB729; }
.black{ background: #000; }
.color_box{
    width: 20px;
    height: 20px;
    display: inline-block;
    vertical-align: -5px;
}
#node_area{
    position: absolute;
    top: 0px;
    left: 0px;
    width: 100%;
    height: 100%;
}
.node_border{
    padding: 10px;
    background: rgba(0,0,0,0);
    border-radius: 8px;
    cursor: pointer;
    position: absolute;
}
.node_border:hover{ background: rgba(0,0,0,0.4); }
.node_selected{ border: 6px solid #333; }
.node{
    position: relative;
    min-width: 40px;
    min-height: 20px;
    border-radius: 8px;
    font-size: 18px;
    text-align: center;
    color: #FFF;
}
.node_text{
    padding: 15px 30px;
    line-height: 45px
}
.remove_node{
    font-size: 13px;
    position: absolute;
    top: 5px;
    right: 10px;
    color: rgba(255,255,255,0.4);
    cursor: pointer;
}
.remove_node:hover{ color: #FFF; }
#relationships{
    width: 100%;
    height: 100%;
}
Now before you go look at the page, there are a few placeholders we have to set up. Let’s open the main.js file and append the following code to the end of that file:
Template.nodes_page.graph_name = function(){
    var graph = Session.get(“current_graph”);
    return graph.name;
}
Template.nodes_page.events({
    ‘click #new_node’ : function(){
        var graph = Session.get(“current_graph”);
        Grapher.Nodes.create(“New Node”, “blue”, {x:250, y:250}, graph._id);
    },
    ‘click .remove_node’ : function(){
        Grapher.Nodes.delete(this._id);
    },
    ‘dblclick .node_text’ : function(){
        var text = prompt(“Please enter the new text”, this.text);
        if(text){
            Grapher.Nodes.change_text(this._id, text);
        }
    },
    ‘click #go_back’ : function(){
        Session.set(“current_graph”);
    },
    ‘click .node’ : select_node,
    ‘click #relationships’ : unselect_node,
    ‘click .color_box’ : color_node,
    ‘mouseover .node’ : drag_node,
    ‘click .node_border’ : add_relationship,
    ‘mousemove #node_area’ : draw_line,
    ‘dblclick .rel_line’ : delete_relationship
});
The first placeholder should be quite familiar by now, what it does is to get the currently selected graph, and returns its name. Next, we have the complete event-map for this view, for the sake of not overloading you with information, I decided to use regular functions instead of the anonymous kind. This way I can show you a piece at a time while not having to say things such as “insert on line xx between the other and so on”. Now all you have to do is keep appending to the bottom of the file.
Let’s quickly walk through the parts that I did include. We have the new_node function—very similar to the new_graph function we wrote—that inserts a new node with some defaults using the node object we planned out earlier. Next, we have the remove_node function, which triggers when you click one of the little x marks on the nodes. We then have the change_text function, which I don't think needs any explanation, as we had the same thing with the graphs. And last but not least, there is the go_back function, which clears the currently selected graph, causing Meteor to automatically go back to the graphs page.
The next three functions have to do with coloring a node. In order to change a node’s color, you first have to select it, and then you can click one of the color boxes in the toolbar. To implement this, we are going to set a Session key when a node is clicked, and unset the Session variable when the user clicks on the background. Here is the code for selecting and unselecting a node:
function select_node(){
    Session.set(“node_selected”, this._id);
}
function unselect_node(e){
    if(e.target.id == “relationships”){
        Session.set(“node_selected”);
    }
}
The select function is pretty simple, but in the unselect function we have this if statement. That is because this event will trigger anytime someone clicks the background or anything on the background (basically everything). It is how events work in JavaScript, so to work around this, we are just checking that the clicked item is in fact the background and not something else such as a node or something.
We now have a Session variable that can tell us if a node was selected or not, so let’s implement the template placeholder, which will add some CSS to show which node is currently selected:
Template.node.selected = function(){
    if(Session.equals(“node_selected”, this._id)){
        return “node_selected”;
    }
    return “”;
}
If you recall, we placed this placeholder in the class field of the node template. So if the specified node is selected, it will add the node_selected class; otherwise it will add a blank string. Now that we are able to select nodes we can color them. Here is the function to change a node’s color:
function color_node(e){
    var color = $(e.target).attr(“color”);
    var node = Session.get(“node_selected”);
    if(color && node){
        Grapher.Nodes.change_color(node, color);
    }
}
This function is called whenever one of the color boxes gets clicked. The first thing to do is store the color, which we assigned to an attribute, appropriately named color. Then we get the currently selected node, and if both of those objects check out, we use our Nodes object to change the color. Now let’s just add the template function to get all nodes and you should have a good base ready:
Template.node_section.nodes = function(){
    return NodesModel.find({});
}
Nothing new to note here, besides the fact that we added this placeholder under the node_section template, instead of the nodes_page template. The MongoDB stuff should be very familiar to you.
So far everything we have done has been Meteor-compatible, but now we need a way to drag-and-drop nodes. We could set up some mouse events to capture mouse downs and mouse ups, but doing so will find you many bugs. First of all, once you check for a mouse up event, you basically give up the ability to use click events, as the mouse up will override it. Besides that, going with a Meteor approach (that is, updating the database and letting Meteor do the work), is not very data-conscious, as in order to get smooth movements across the screen, you would need to update the database at every twitch of the mouse. So instead we will be using jQuery UI’s drag-and-drop functionality to move the nodes around, and only when a node stops (the user lets go of a node), will we update the database.
You are probably used to adding a script tag in the top or bottom of your HTML files in order to add JS libraries, but remember the whole Meteor application is already JavaScript, so adding it to one of the folders (except for public and server) will automatically load it in. This still goes by the rules of the loading order, so if you need it in a certain file make sure the library either starts with a higher letter in the alphabet or put it in a more nested folder. In our case, though, since we are loading everything from the main.js file, and files named main are purposefully loaded last, we can just put it right in the client folder.
So navigate to http://jqueryui.com/ and download the latest version of jQuery into the client folder. With that installed we can write the next function to allow node-dragging:
function drag_node(){
    var height = $(window).height()-10;
    var width = $(window).width()-10;
    $(“#” + this._id).draggable({
        handle:”.node_text”,
        containment: [10, 190, width, height],
        stop  : function(e, u){
            var node_id = e.target.id;
            Grapher.Nodes.move(node_id, {
                x: u.offset.left,
                y: u.offset.top
            });
        },
        drag : node_moved
    });
}
Let’s start at the top. jQuery UI allows us to set a binding box, so we can contain the node in the bottom half; this will make sure people don’t drag nodes under the toolbar. So the first two lines get the height and width of the window. We set the ID of each node’s div tag to the node’s own database ID, this allows us to easily select it as is shown, through jQuery. We then pass a couple of parameters to the draggable function that makes the nodes well, draggable. The handle property allows you to select what the user has to drag in order to move this object. We have a couple of things in our nodes: we have the node’s border, the x button, and the text, so we set the draggable functionality to the outermost div tag, but we tell jQuery to only move it when dragged from the text. The containment property I mentioned, allows you to set a bounding box, which we are setting to the screen’s width and height minus the toolbar and some padding.
Next, we have the stop function, which gets called when the user lets go of the div tag. This is where we can update the node’s properties in the database. The problem is that since the stop function is a callback, we will no longer have access to the node’s context so we cannot get the ID through traditional means. Luckily, we did store the ID as the DOM’s ID as well, so it’s fairly trivial to retrieve the information through there.
The last callback in this function gets called whenever the node moves; we haven’t covered relationships yet, so I decided to reference a function we will make soon.
The final thing required to get this page fully operational is to implement the relationships. In order to create a relationship, a user has to click on one node’s border to start a line and then on the second node’s border to complete it. With that information, here is the entire function to add a new relationship:
function add_relationship(e){
    if($(e.target).hasClass(“node_border”)){
        var node_a = Session.get(“started_drag”)
        if(!node_a){
            Session.set(“started_drag”, this);
        }
        else{
            Grapher.Relationships.create(node_a._id, this._id);
            Session.set(“started_drag”)
            d3.select(“#mouse_line”).attr(“stroke-width”, 0);
            render_lines();
        }
    }
}
We begin by making sure the user clicked the node’s border and not something on top of the node’s border. Next, we see if this is the first click, in which case we need to start the new node process, or if this is the second click, in which case we will save the relationship to the database. When the user is in the middle of creating a relationship, the mouse line in the SVG element will be used to render the line, like we talked about. So once the relationship has been created, we can remove the mouse line by setting its width to zero. Finally, we have a call to render_lines, which will refresh the drawing of the relationships; this is required because we placed the SVG inside a constant tag, so we have to manually update them.
As you saw in this function, we set a Session variable telling us if we were in the middle of a drag or not, but the actual drawing of the line happens in this next function:
function draw_line(e){
    var node = Session.get(“started_drag”);
    if(node){
        var n = get_node_center($(“#” + node._id));
        setup_line(d3.select(“#mouse_line”), n, {
            x: e.pageX,
            y: e.pageY
        });
    }
}
The first two lines get the Session variable and check to see if we are in the middle of a drag. If we are, then it gets the first node’s center and passes that to a function named setup_line together with the location of the mouse.
We talked about proper separation of concerns as well as function abstraction, and since we will both be drawing a line here for the temporary one as well as a line for each relationship, it wouldn’t be good to have this code in two places, that it why I separated the part that gets the node’s center as well as the actual d3 call to draw the node. Here are those two functions I separated:
function get_node_center(jquery_node){
    return {
        x : (jquery_node.width() / 2) + jquery_node.offset().left,
        y : (jquery_node.height() / 2) + jquery_node.offset().top
    }
}
function setup_line(d3_line, p1, p2){
    d3_line.attr(“x1”, p1.x).attr(“y1”, p1.y).attr(“x2”, p2.x).attr(“y2”, p2.y).attr(“stroke-width”, 5).attr(“stroke”, “black”);
}
The first one gets the node’s center, using some basic math, while the second function makes the call to d3 to draw a line. Don’t worry if you are unfamiliar with d3 or SVG, as it’s not the main point of the book, but for clarity I’ll run through it quickly. SVG elements allow you to insert different shapes, all defined with an HTML style of tag names and properties. To draw a line, you use the line element and pass in the x and y coordinates for both the start of the line and the end. Besides that we need to set the color and the thickness.
We are really close now. The next function we have to write is the render_lines function. This function is the one in charge of rendering the relationships area, because if you remember, we took the responsibility away from Meteor. Here is the complete function:
function render_lines(){
    d3.select(“#lines”).remove();
    d3.select(“#relationships”).append(“svg:svg”).attr(“id”, “lines”);
    RelationshipsModel.find({}).forEach(function(rel){
        var n1 = $(“#” + rel.node_a);
        var n2 = $(“#” + rel.node_b);
        if(n1.length && n2.length){
            var line = d3.select(“#lines”).append(“svg:line”).attr(“class”, “rel_line”).attr(“rel_id”, rel._id);
            setup_line(line, get_node_center(n1), get_node_center(n2));
        }
    });
}
We begin by clearing all the old lines through d3, by deleting the line’s container and reinserting a blank one. After that, we cycle through all nodes in the relationships database calling the forEach method, which calls a function per item inside. Next we grab the two nodes that are stored in this relationship and make sure they exist. If jQuery cannot find them, they don’t exist. Normally you wouldn’t want to match DOM elements with data, because people could modify it, or you may get inconsistencies. But in Meteor the DOM is defined directly by the data, so this is a relatively safe assumption. If the nodes exist, we create a new line element with a class of rel_line and an ID set to the relationship’s ID. We then take the line plus the centers of both nodes, and pass them to our setup_line method that we just created.
We are basically done, just a few calls to render_lines are needed to keep the UI up-to-date:
Template.node_section.rendered = function(){
    render_lines();
}
This function will run when the page renders, so that’s a good place to initially draw the lines. Next, when we delete a relationship we need to update the lines:
function delete_relationship(e){
   Grapher.Relationships.delete($(e.target).attr(“rel_id”));
   render_lines();
}
And finally when you move a node, we have to keep the lines up-to-date (so they follow the moving node):
function node_moved(){
    render_lines();
}
That is all the code; open up the page, and you should be able to create nodes, move them around, change their color, and connect them, and so on. Switching between users or graphs, you will notice one issue—all the data is showing up for everyone (the nodes from one graph are showing up on all the graphs), as shown in the following screenshot:
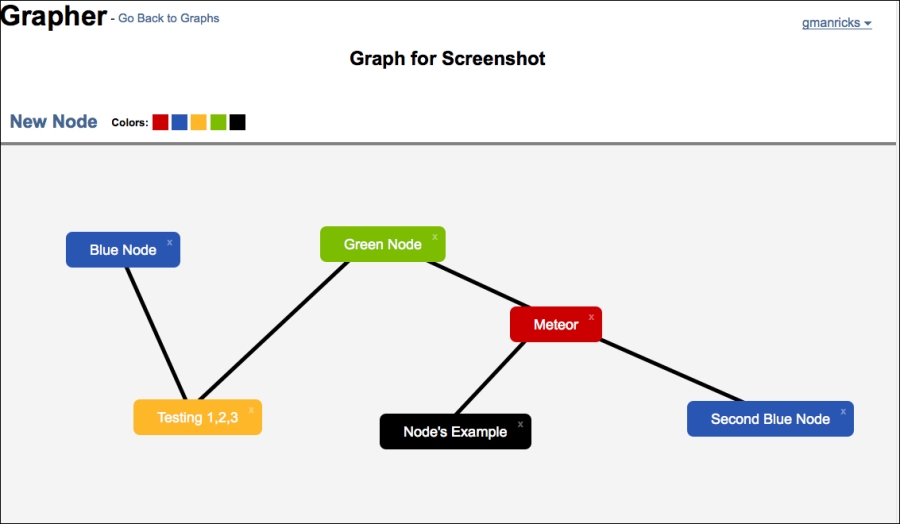
In the next section, we will talk about data manipulation and security in order to lock down on that problem.
By default, Meteor comes with a Smart Package named autopublish enabled; this package sends all data all the time. It’s great for development as we didn’t need to worry about it until now, but the time has come to manually handle this. We created two files named model.js, one in the client folder and one in the server folder; this is where we can put the necessary code to fix this.
Let’s begin with the graph’s data. We need to make sure that the server is only sending the graphs that belong to the logged-in user. Meteor uses a publish-subscribe method of transmitting data (currently all data is being published because we have the autopublish package), but we are going to remove it, so we need to manually specify what to send.
The simplest of the three databases is the graph’s database; we just need to tell it to send all graphs that belong to the current user. Open up the model.js file located inside the server folder and add the following:
Meteor.publish(“graphs”, function(){
    return GraphsModel.find({“owner” : this.userId});
});
We create a new broadcast, which we name graphs. Inside the function, we return all graphs that have the correct owner. Then to pick up this broadcast we need to create a subscribe event. So open the other model.js file, the one in the client folder, and add the subscribe call:
Meteor.subscribe(“graphs”);
Now we are picking up those rows from the server. Next let’s get the nodes for the currently selected graph. So, in the server’s Model file, enter the publish function for nodes:
Meteor.publish(“nodes”, function(graph){
    return NodesModel.find({“graph” : graph._id});
});
There is no standard feature to get the currently selected graph, so we need to pass it through from the client. Besides the transmitted parameter, there is nothing new here. Back in the client’s Model file, we can subscribe to the new publish event:
Meteor.autorun(function () {
    Meteor.subscribe(“nodes”, Session.get(“current_graph”));
});
Here we have a new Meteor function named autorun. What autorun does is create a reactive context. This means anytime one of this function’s dependencies change, which in our case is the current graph, the function will reload. Additionally, you can see that to pass in variables to the server, you just add them after the broadcast’s name.
The last database we have to transmit is the relationship’s database. Here things get a little tricky; if we had stored the graph ID with each relationship or even the user’s ID, then we would just make a similar call and be done with it. But we did neither, so some work is going to have to be done. Go back to the server’s model.js file and insert the following code snippet:
Meteor.publish(“relationships”, function(nodes){
    return RelationshipsModel.find({$or : [
        {“node_a” : { $in : nodes}},
        {“node_b” : { $in : nodes}}
    ]});
});
This function gets a list of nodes that are in a given graph and does a more advanced MongoDB call. We are requesting all rows where you can find one of the node’s IDs in either the node_a slot or the node_b slot. The $or parameter lets you provide an array of standard MongoDB definitions, and if any of them check out the row will be returned.
Then we have something called $in, if you’ve used SQL before then it works the same way. Basically, it looks at whether any of the objects in the array match the given key, so if either node A or node B show up in the list of rows, then it will be returned.
Now we can’t just put this subscription together with the others, because the relationships aren’t in a reactive context (we put them in a constant field). So let’s put it in the main.js file. Scrolling down, you will find a call being made to Template.node_section.rendered near the bottom of the file. Whenever this section renders (that is, the nodes change), we set it to update the lines. Replace that function with the following:
Template.node_section.rendered = function(){
    var nodes = NodesModel.find({}).fetch();
    var node_ids = new Array();
    for(var k in nodes){
       node_ids.push(nodes[k]._id);
    }
    Meteor.subscribe(“relationships”, node_ids, function(){
        render_lines();
    });
}
The first line selects all the nodes. We used the forEach call before, and that was fine but here we don’t want to do something with each row; we just want an array of values. To get this, we just use the fetch command on the collection’s response (the cursor).
Once we have the response, we can cycle through the nodes and push their IDs into an array named node_ids. Then we subscribe to the relationships’ broadcast and pass in the array of nodes as a parameter. The final parameter is a callback function which gets run after the new data gets returned; here we are just reinserting the call to render the lines.
The last thing to do in order to make this work is to remove the autopublish package from Meteor. Open the terminal window where Meteor is running and type Ctrl + C to quit, and then type:
meteor remove autopublish
Lastly type meteor again to restart the server.
Now go try logging in under different users and open different graphs. If all went well, it should be working as expected. But there is still one issue left, the database is on the client side. What is stopping someone from opening up the JavaScript console and manually modifying other people’s stuff? The answer might surprise you, but it is nothing. In the application’s current state, anyone can manually modify anyone else’s data. It’s the same kind of problem as the autopublish package faced. For ease’s sake, Meteor enables a package named insecure by default. This package allows anyone to change any data; of course this is great for development but terrible for production. So instead of letting everyone do everything, we need to set permissions for each table.
Let’s begin as usual with the graphs Model. Open up your global.js file that is in the root folder and enter the following at the bottom of the file:
if(Meteor.isServer){
    GraphsModel.allow({
        ‘insert’ : graph_user_match,
        ‘remove’ : multi_graph_user_match,
        ‘update’ : multi_graph_user_match
    });
    function graph_user_match(user, doc){
        if(doc.owner != user){
            return false;
        }
        return true;
    }
    function multi_graph_user_match(user, docs){
        return _.all(docs, function(doc){
            return graph_user_match(user, doc);
        });
    }
}
We are making sure that we are on the server with the if statement and then we assign the three different query types a function on the MongoDB collection. The insert command only accepts one document at a time, while the remove and update functions allow for multiple rows at once. So I created two separate functions, one for a single graph object and one for a group of objects. If you take a look at the functions, we check to make sure the document’s owner equals the currently logged-in user. In other words, a user can only modify his own stuff. If you now look at the multi_ function, it cycles through all the rows that are being updated and it passes each one to our first function. The _.all command is from underscore.js, a library that Meteor uses, and what it does is it cycles through an array of objects. If all the rows return true, then this command returns true; otherwise if even one returns false, it will return false.
Next let’s add the code for the nodes database; write the following at the bottom of the if statement (but still inside):
NodesModel.allow({
        ‘insert’ : node_user_match,
        ‘remove’ : multi_node_user_match,
        ‘update’ : multi_node_user_match
    });
    function node_user_match(user, doc){
        return graph_user_match(user, GraphsModel.findOne({_id: doc.graph}));
    }
    function multi_node_user_match(user, docs){
        return _.all(docs, function(doc){
            return node_user_match(user, doc);
        })
    }
Looks familiar? It is essentially the same as before, but with one key difference. If you recall the node object doesn’t contain a reference to the user who owns it; it only contains a reference to the graph. So we get the graph object using this reference and some MongoDB and pass it along with the user’s ID to the previous function for checking graphs.
Now the relationships database requires two checks, as each of the two nodes has to be checked to see if the user owns it. Put the following code right after the code you just wrote (still inside the if statement):
RelationshipsModel.allow({
        ‘insert’ : rel_user_match,
        ‘remove’ : multi_rel_user_match,
        ‘update’ : multi_rel_user_match
    });
    function rel_user_match(user, doc){
        var node_a = node_user_match(user, NodesModel.findOne({_id: doc.node_a}));
        var node_b = node_user_match(user, NodesModel.findOne({_id: doc.node_b}));
        return (node_a && node_b);
    }
    function multi_rel_user_match(user, docs){
        return _.all(docs, function(doc){
            return rel_user_match(user, doc);
        });
    }
Now according to some elementary logic, this code has to first load the node and then load the graph and then check the user. That’s three times more checks than the code for the graphs database, yet the code is about the same size. This is another great example of code abstraction. For each of the two nodes, we get the database object and send it through to the previous node function, the node function will pass it to the graphs’ function, ultimately returning true are false. We then match it up to make sure both nodes are true, and we return a Boolean value accordingly.
Note
As of Meteor 0.5.8 and onwards, you can no longer update or remove multiple documents at once, and as such the multi_ functions we just created to map the array of documents will no longer work. Instead you would just use the same “single” version of the function we created for insert on the remove and update methods as well.
We can now remove the insecure package, so in the terminal window where meteor is running, type Ctrl + C to exit the process, and then type:
meteor remove insecure
With that done, type meteor again and the application should be up and running and fully secure.
Now before we get to deploy our app, let’s sum up what we have done so far. We planned out our data, objects, and pages. We then structured our files in a way that makes sense. We went page-by-page implementing our design and working around common issues that tend to come up. Last but not least, we tightened down which data gets sent to the client, and set up permissions, thus making everything secure.
Our app is pretty good, but there is room for improvement. Moving forward, you can optimize the data usage; for example, when you delete a graph, it should remove all nodes and relationships inside. You can also play around with adding different relationship types, such as relationships with arrows to show direction, or relationships with Boolean values to represent logic statements, and so on.
Now, we will take a look at deploying a Meteor app.
Meteor doesn’t really lock you down when it comes to deploying your app; you are free to deploy it on any server with Node.js. However, currently, I think it’s a bit early for deploying an app yourself and unless you are a server pro, I would advise against it. There are a couple of issues such as manually setting environment variables and making sure to package the app for the correct operating system. I wouldn’t say it’s impossible and they are working on making it a lot easier. If you still want to do it yourself, you can find all the instructions at http://docs.meteor.com.
The method I am going to show you is the currently recommended way of deploying, and that is to deploy it to Meteor’s own servers. The Meteor team has provided free hosting servers for people to use with their apps, and deploying could not be easier.
Open the terminal window where meteor is running, and type Ctrl + C to close it. Then type:
meteor deploy grapher.meteor.com –password
Then press Enter, which will deploy to Meteor’s servers under the given name. You can’t actually use that name because that’s where I put my copy, but any subdomain of meteor.com that hasn't been taken should work. Because we specified the password tag, Meteor will ask you to enter and verify a password of your choosing, and then it will deploy the server for you.
After that if you would like to update your site, you just run the command again:
meteor deploy grapher.meteor.com
This time without the password option (unless you want to change your password), and Meteor will update your site.
You also have the option of using your own domain, as shown in the following command:
meteor deploy www.mysite.com
But you would need to create a CNAME DNS record to point to origin.meteor.com.