

At times when the application opens up, you may want to zoom it to a particular area of interest, instead of showing the map at the world scale first, and then zoom your way to the area you want to see. To accomplish this, the map module provides a property to set its initial extent and also to programmatically change its extent any time you want.
Before this, let's look at what an extent is in the context of a map.
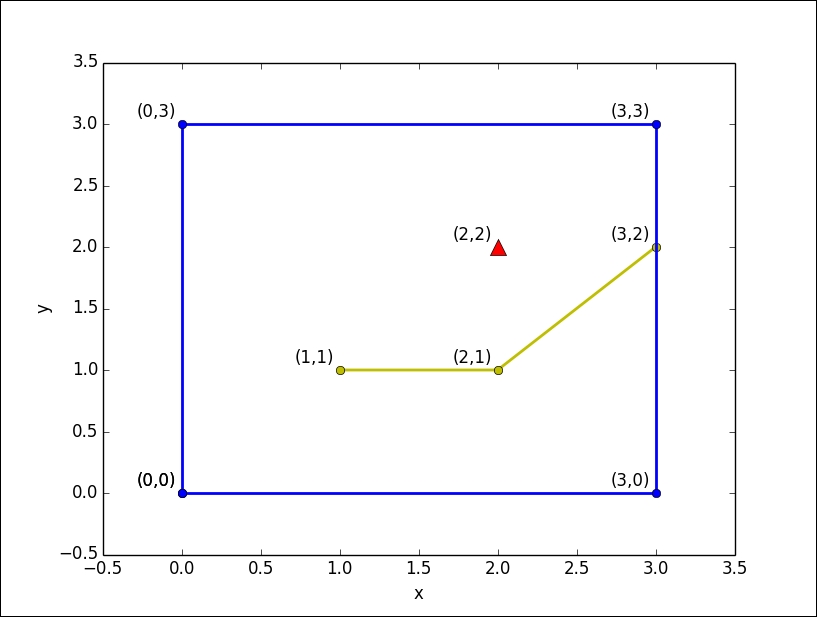
To understand about extent, a grasp of coordinate geometry would help. Line segments colored yellow will be referred to as polyline for our purposes. The blue lines represents polygons (a rectangle in our case):
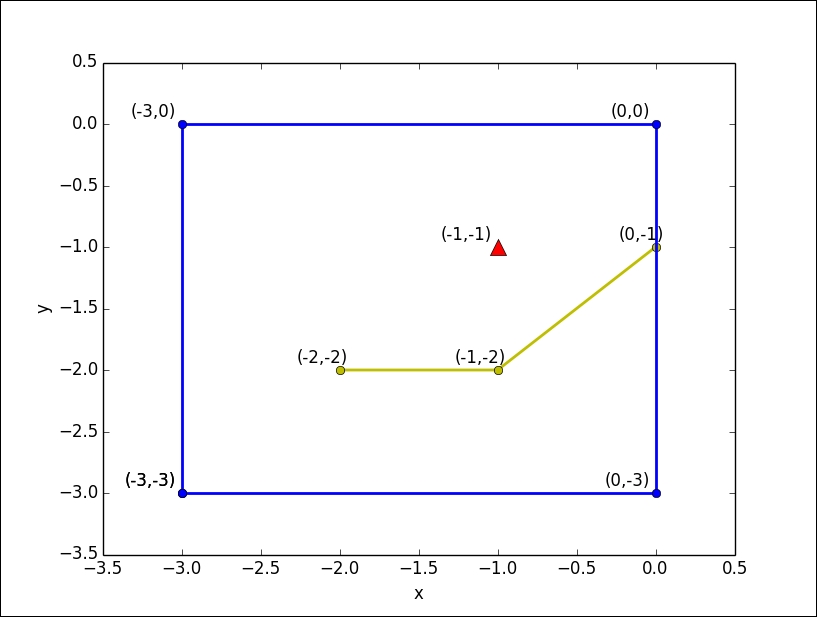
Now, try to observe the difference in the coordinates between the preceding diagram and the following diagram:
Here are some notes about the preceding diagrams:
The point is represented by just one pair of coordinates; (2, 2) in figure 1 and (-1, -1) in figure 2
The polylines are represented by a sequence of coordinates
The polygon is also represented by a sequence of coordinates, similar to the polyline
You might have figured out that apart from the coordinates and the axes, the shapes of both the figures are the same. This might mean two things:
The diagram has shifted its x positions by -3 units and its y positions by -3 units
Or it may mean that the origin has shifted its x and y positions by -3 units
The second possibility is more important for us to understand because it implies that the actual position of the diagram hasn't changed and only the origin or the coordinate axes has changed its position. So, in reference to the coordinate axes, the coordinates of the diagram shapes (the rectangle, point, and line) have also changed.
Note
The same shape can have different coordinates based on the reference coordinate system. This kind of coordinate system is known as a spatial reference in the context of GIS.
Let's test our knowledge. Try solving the following quiz:
Q1. What would be the coordinates of the point (with the triangle symbol) if the origin (the bottom-left corner of the rectangle) were (100000, 100000)?
Q2. Since the polygon and the polyline are both represented by a sequence of coordinates, how can we conclude whether the shape is a polygon or polyline given a sequence of coordinates?
Q3. How many coordinates are required to represent a rectangle?
Think about it and we'll give you the answers very soon.
When displaying the world or a part of the world on a digital screen as a map, which is a two-dimensional surface just like our graph, we need to use a spatial reference system to identify the coordinates of locations on the map. There are numerous standard spatial reference systems in use. The bare minimum we need to know to proceed with using the API is that each reference system has a unique identification number that is recognized by the API. The complete parameters (such as datum used, origin coordinates, measurement units used, and so on) used to define a spatial reference can also be used to identify a particular spatial reference system.
Note
The unique ID with which an SRS is identified is known as Well-known ID (wkid).
A string listing the parameters used to define a spatial reference system is known as Well-known Text (wkt).
As you might have anticipated, each spatial reference system is associated with different measurement systems such as feet, meters, or decimal degrees.
For example, 4326 is the wkid of the global coordinate system known as WGS 84. The measurement unit for this reference system is decimal degrees.
102100 is the wkid of another global coordinate system whose measurement unit is meters.
The following URLs give a list of wkids and the corresponding wkt at https://developers.arcgis.com/javascript/jshelp/pcs.html and https://developers.arcgis.com/javascript/jshelp/gcs.html.
A 1. (100002, 100002)—relative to the origin, the point is 2 units away in the positive x-direction and 2 units away in the positive y-direction.
A 2. A sequence of coordinates can either be a polyline or a polygon unless mentioned explicitly in the geometry object. But a polygon has one property that makes it different from a polyline—the first and last coordinate must be the same. A polyline can have the same first and last coordinates, but not all polylines fulfil this criteria.
A 3. If your answer was 4, that's great! But if your answer was 2, you're awesome.
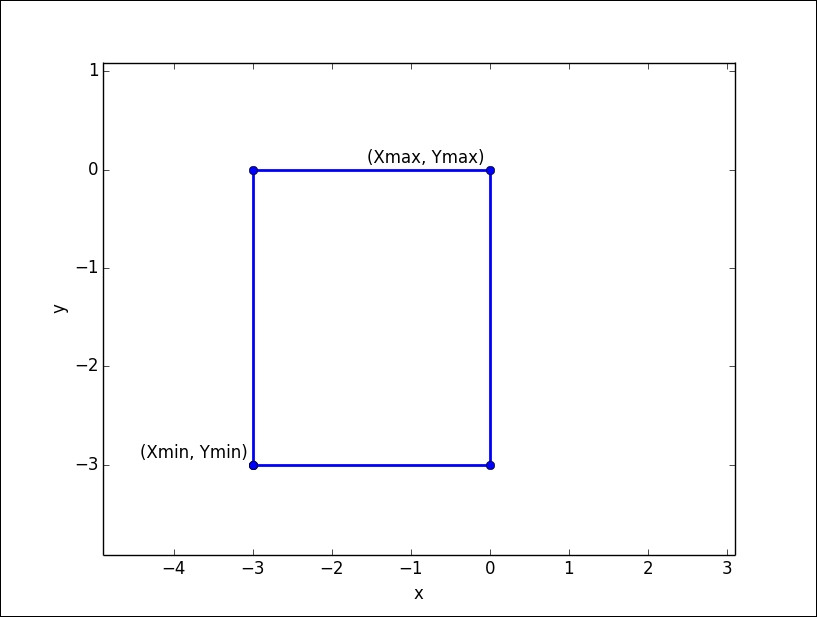
That's right. Just two coordinates are sufficient to define the rectangle, thanks to its perpendicularity property. The two coordinates could be any pair of diagonally opposite coordinates, but for the sake of the API, we will take the left-bottom coordinate and the upper-right coordinate. The bottom-left coordinate has the minimum x and y coordinate values among the 4 coordinate value pair, and the upper-right coordinate has the maximum x and y coordinate values:
Zoom the map to the extent you want to set as the initial extent of the map. In the jump start code, the map variable is a global object since this is declared outside the require function:
<script>
    var map; //Global variable
    require([
      "esri/map"
    ],
      function (
        Map
      ) {
        map = new Map("myMap", {
          basemap: "national-geographic"
        });
});
});
</script>
This means that we can access the map's properties in the browser console. After zooming the map and the extent you want as the initial map extent, open the developer tools using the Ctrl + Shift + I command (in Chrome). In the JavaScript browser console, try to access the map properties, getMaxScale(), getMinZoom(), getMinScale(), getMaxZoom(), getScale(), and extent:
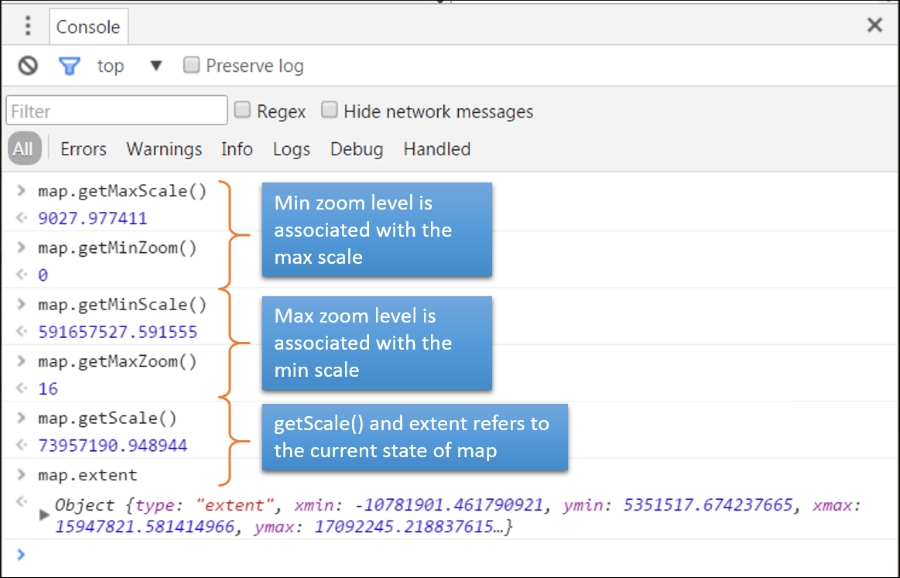
Scale is literally the factor with which the map measures are scaled down from the real-world measures. Maximum scale shows the greatest details on the map, and the minimum scale of the map shows the least detail. The values for map.getMaxScale() is smaller than that for map.getMinScale(), because the scale values represent reciprocal numbers. Hence 1/591657527 < 1/9027 (1/9027.977411 and 1/591657527.59…, respectively, in our instance).
Zoom levels, on the other hand, are the discrete scale levels at which the map is displayed. Most maps that involve Basemaps or Tiledmaps (which will be discussed in later chapters) can only be displayed at specific scale levels known as zoom levels. The minimum zoom level is mostly 0 and is associated with the maximum scale of the map.
map.getScale() gives us the current scale, and map.extent gives us the current extent of the map. We can use this extent object to set the extent of the map using the setExtent() method in the map. Refer to the API documentation for the map module and navigate to the setExtent method of the map. The setExtent() method accepts two parameters—the Extent object and an optional fit object. When we click on the hyperlinked Extent object, as provided in the document, it redirects us to the API documentation page for the Extent module:
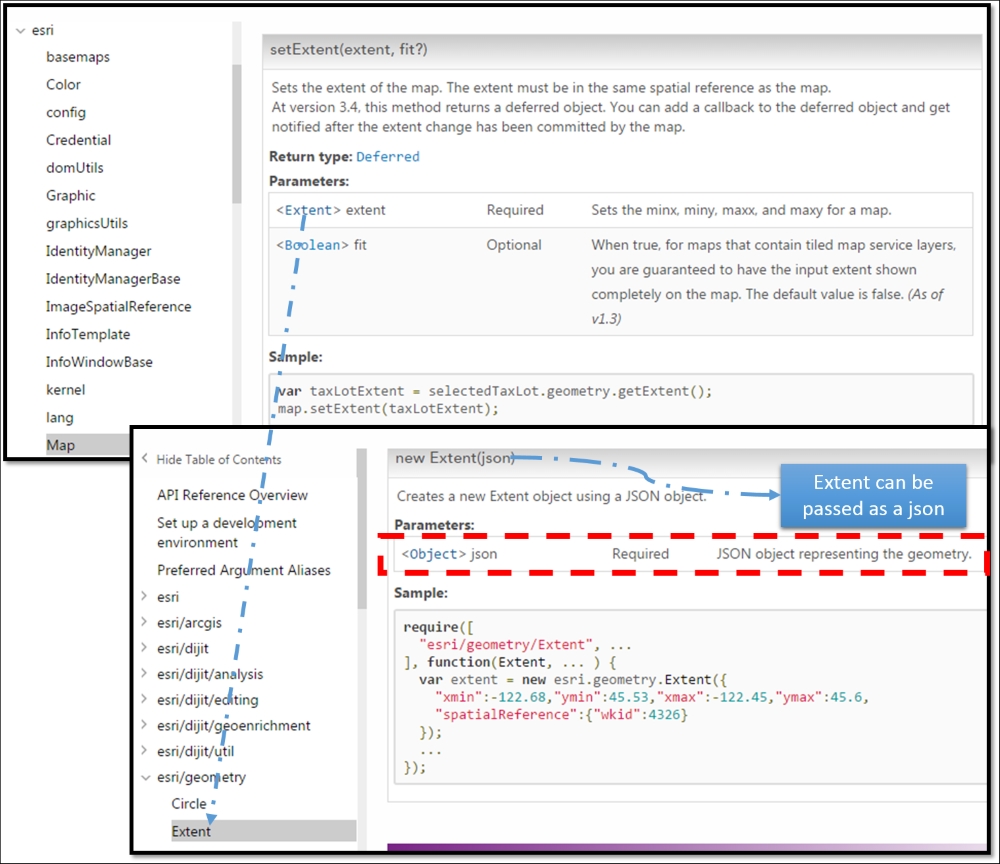
The constructor for Extent accepts a JSON object and converts it into an extent object. We can obtain this JSON object from the JSON string of the map's extent:
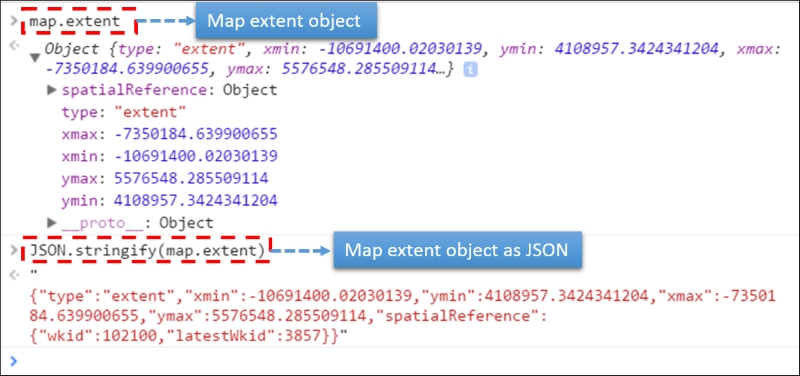
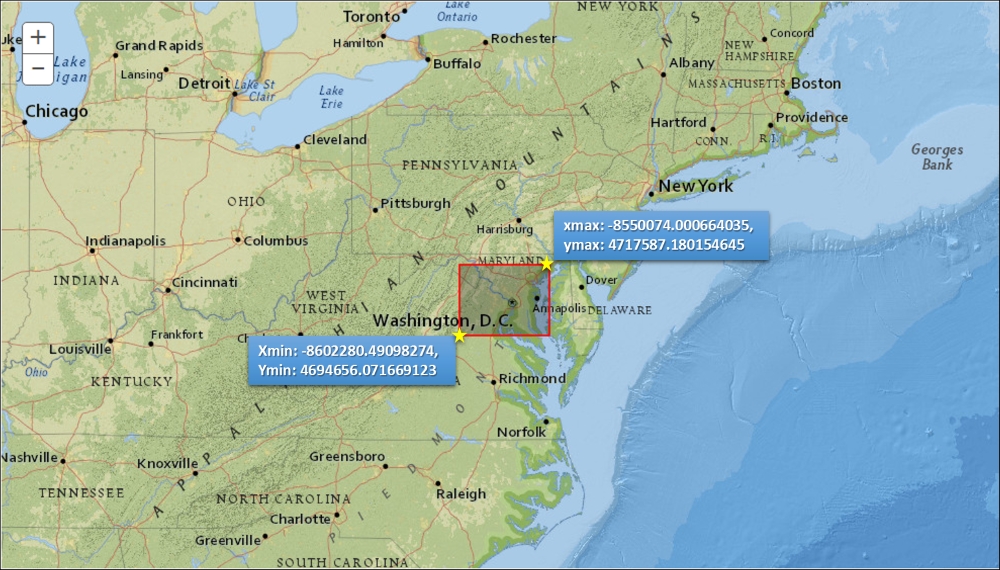
The preceding image shows us the JSON string of the extent of the map that we have zoomed into. The following screenshot displays what the coordinates mean with respect to the map area we intend to zoom into (which is highlighted with the rectangle):
Now, we can copy the JSON object, create an Extent object, and assign it the setExtent method of the map. But before this, we need to import the Extent module (esri/geometry/Extent). The following screenshot explains how to implement this:
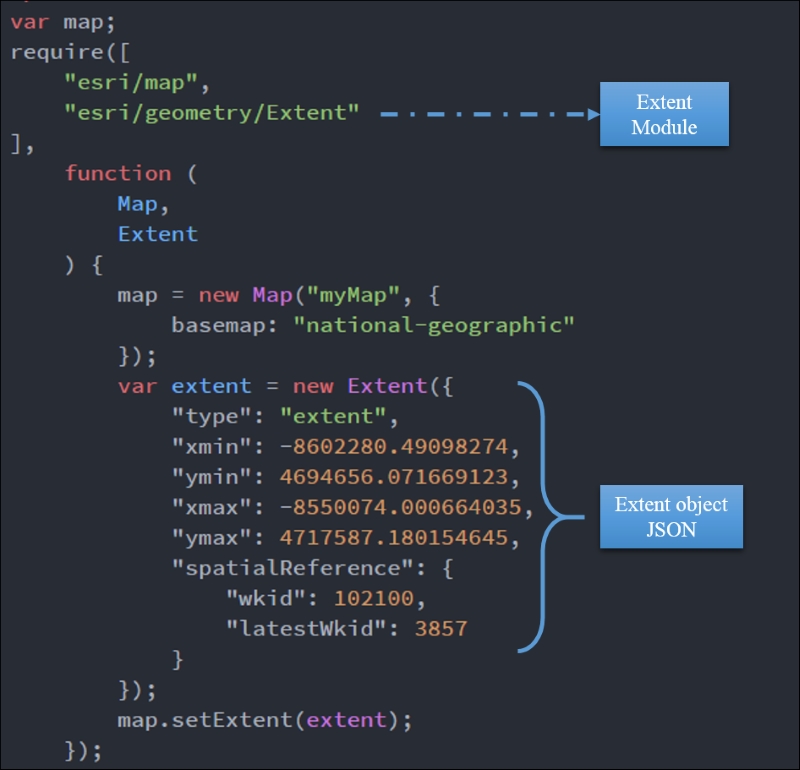
When we refresh the map now, the map will automatically zoom into the extent that we have set.
In the previous code where we successfully set the initial extent of the map, we had to use two modules: esri/map and esri/geometry/Extent. As the application grows, we may need to add many more modules to add additional functionality to the app. For a novice user, finding the module names from the API and incorporating them into the app might be cumbersome. This has been made easy using a web app template generator that can be found at http://swingley.github.io/arg/.
The following is a screenshot of the application:
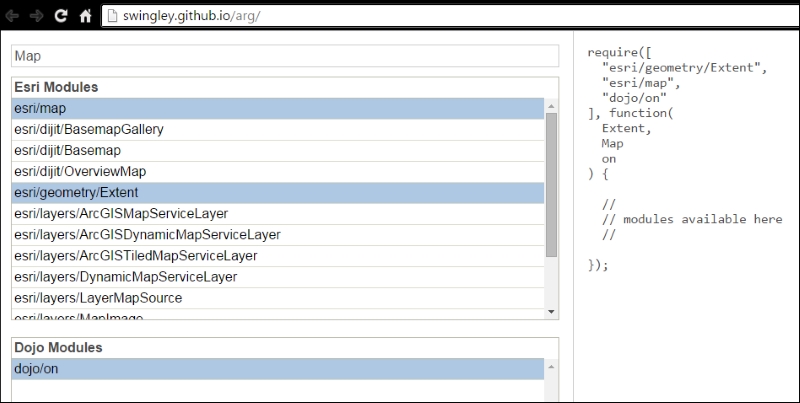
The modules that are needed for our require function can be typed into the text box provided at the top of the application. There are two multi-selection list boxes: one listing the Esri modules and the other listing the dojo modules. Once we start typing the name of the modules required for our application, the list gets populated with the suggested modules matching the name we have typed. Once we select the module we need from either list box, it gets added to the list of modules in the require function, and an appropriate alias is added to the callback function as a parameter. Once all the required modules are selected, we can use the bare bone template being generated on the right side of the app. For setting the initial extent of the map, you may load the required modules by searching for the following names:
Map (
esri/map)Extent (
esri/geometry/Extent)