-
Book Overview & Buying
-
Table Of Contents

React Application Architecture for Production - Second Edition
By :
React Application Architecture for Production
By:
Overview of this book
Building production-grade React applications requires making dozens of architectural decisions, often with little cohesive guidance. This book teaches proven architectural patterns for building scalable, maintainable frontend apps, based on timeless principles and modern best practices.
This updated edition features a modern stack: React Router in framework mode, TypeScript, TanStack Query, Zustand, React Hook Form, Zod, Shadcn UI, Vitest, and Playwright. It also adds new chapters on performance, accessibility, and internationalization. You’ll work through a real-world example that brings modern architecture concepts to life.
Starting with architectural foundations, you’ll make informed decisions about project structure, enforce code quality, build a well-designed component library, and implement the right rendering strategies. From there, you’ll build robust API layers with types generated from an OpenAPI specification and implement the right state management strategies for each use case. You will also learn about different testing strategies and when to use them, how to secure the application, and how to make it performant so that it remains scalable and maintainable.
By the end, you’ll be prepared to design and build scalable React apps from the ground up and lead technical decisions in real-world projects.
Table of Contents (17 chapters)
Preface

 Free Chapter
Chapter 1: Understanding the Architecture of React Applications
Chapter 2: Setup and Project Structure Overview
Chapter 3: Building and Documenting Components
Chapter 4: Routing and Rendering Strategies
Chapter 5: Communicating with the API
Chapter 6: Managing Application State
Chapter 7: Implementing Authentication and Securing the Application
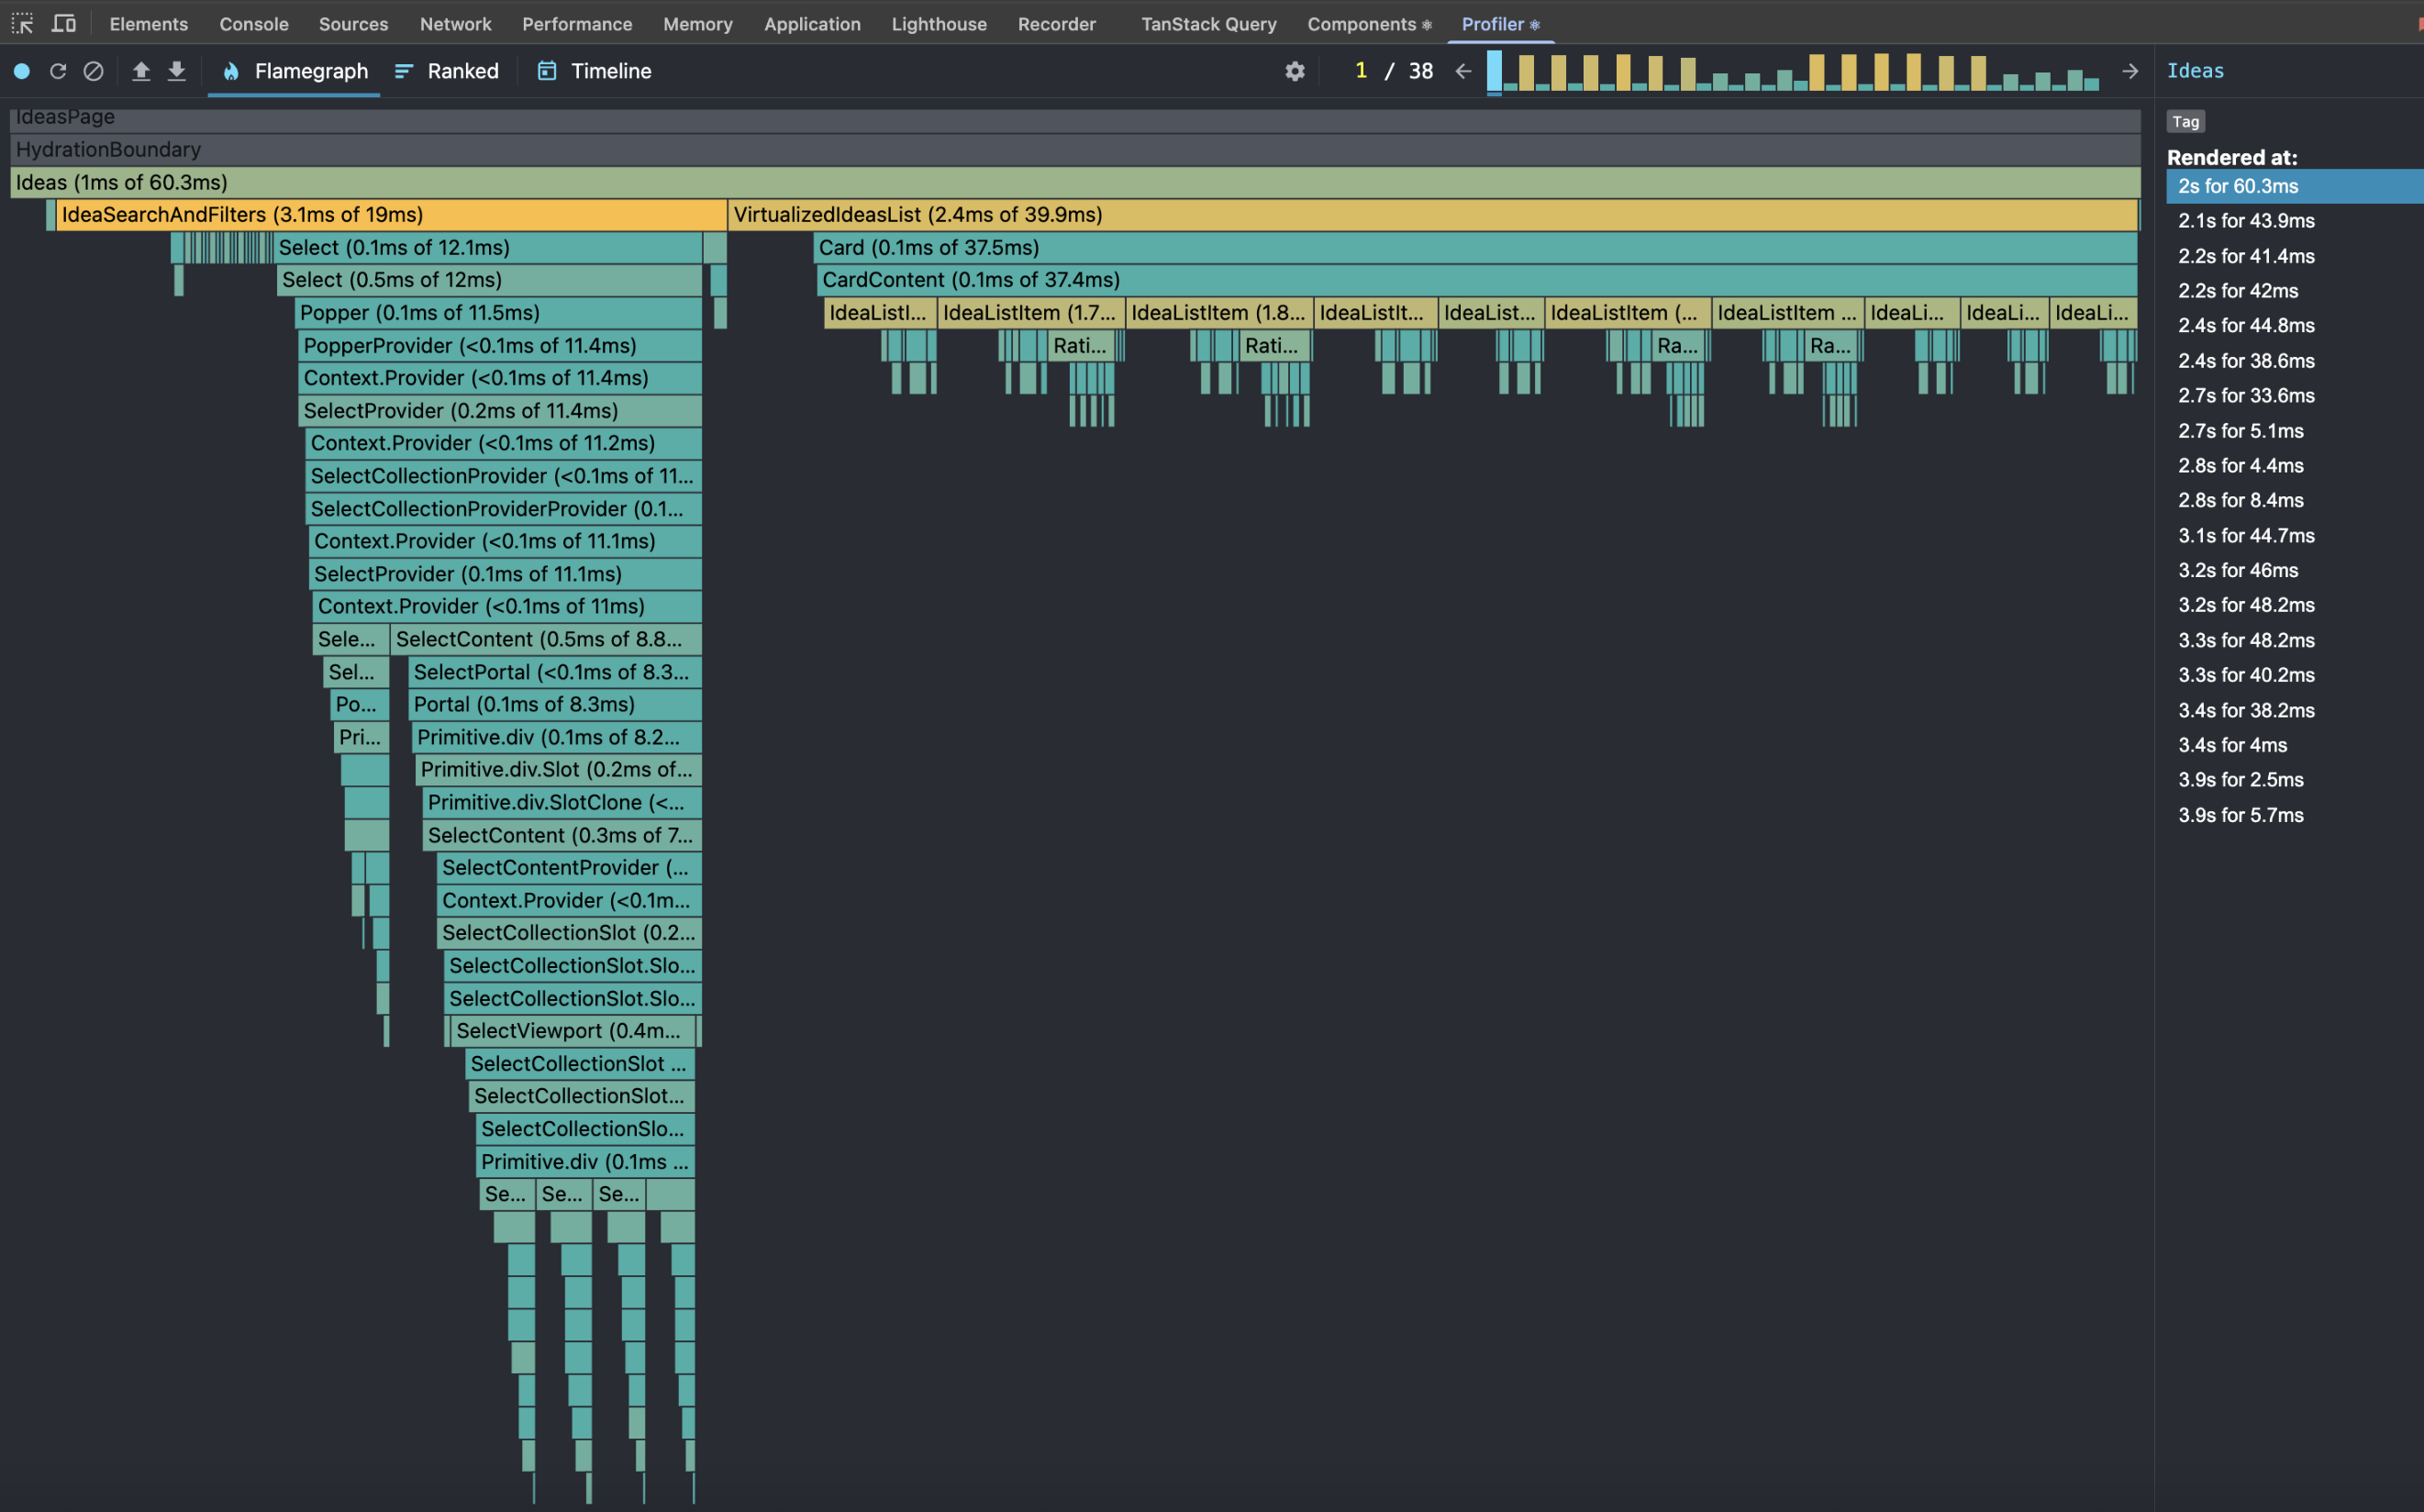
Chapter 8: Improving Application Performance
Chapter 9: Going International
Chapter 10: Making the Application Accessible
Chapter 11: Testing the Application
Chapter 12: Going to Production
Chapter 13: Evolving the Application
Chapter 14: Unlock Your Exclusive Benefits
Other Books You May Enjoy
Index