

Actually, you don't need any coding to create fantastic and interactive visualizations for the web. You can always use a charting service. There are many; some are paid, others are free. They offer configuration screens and data transformation tools that allow you to create all kinds of beautiful charts. Popular services include Google Charts, Tableau, Infogram, and Plotly. If they fully satisfy your data visualization needs, you don't really need this book.
But if you know HTML, CSS, and JavaScript, you don't need to use these platforms. Web standards provide all the tools you need to create any sophisticated graphics, with no restrictions imposed by a platform or a plan. Using web standards also facilitates the integration of your visualizations with web applications, frontend frameworks (such as React, Angular, and Vue) and backend web services (such as resources and data provided by RESTful services).
But do you really need to use a library like Chart.js? Can't you just use standard JavaScript, HTML, CSS, and Canvas?
You don't really need any libraries or frameworks to create and display interactive and animated data visualizations on the Web. Plain standard HTML, CSS, and JavaScript already do that for you. Basic HTML provides structural elements that can be styled with CSS to display simple graphical elements such as colored rectangles. That means you can create a basic static bar chart just applying different widths in CSS to div elements.
Take a look at the following HTML and CSS code:
<html lang="en">
<head>
    <meta charset="UTF-8">
    <title>Title</title>
    <style>
        #data {
            width: 600px;
            border: solid black 1px;
            padding: 10px;
        }
        .label {
            display: inline-block;
            width: 60px;
        }
        .bar {
            display: inline-block;
            background: red;
            margin: 2px 0;
            text-align: right;
            padding-right: 5px;
            color: white;
        }
        #data .bar1 { width: 500px; }
        #data .bar2 { width: 200px; }
        #data .bar3 { width: 300px; }

    </style>
</head>
<body>

<h1>Bar chart</h1>
<div id="data">
    <div><span class="label">Item 1</span><span class="bar bar1">50</span></div>
    <div><span class="label">Item 2</span><span class="bar bar2">20</span></div>
    <div><span class="label">Item 3</span><span class="bar bar3">30</span></div>
</div>

</body>
</html>
If you run it in a web browser, you get the following chart:
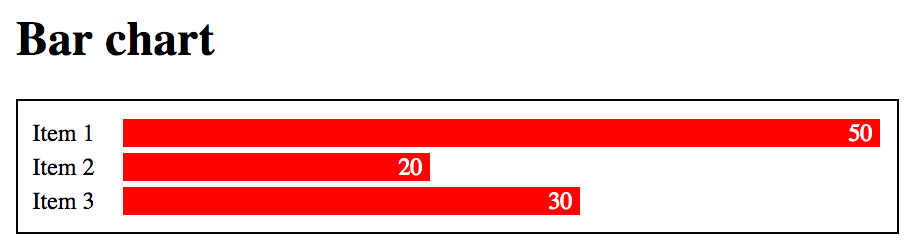
A simple static bar chart created with just HTML and CSS
Of course, this is not the best way to draw a bar chart. The numbers were inserted somewhat arbitrarily in the HTML, and the lengths are defined by CSS width properties. You have to calculate the scales yourself. It's easy to make a mistake and reveal the wrong numbers. This is just to illustrate that all the graphical tools already exist in HTML and CSS. All we need is a library that generates that code for us.
Since the Document Object Model (DOM) allows scripting languages to access and change style attributes of an element, widths can be specified in JavaScript and can even respond to events or change with time, allowing the creation of interactive graphics with animation. Adding the following JavaScript function to the previous chart, you can the change value, length, and colors of the bars when the user clicks on the chart using standard DOM commands:
 <div id="data" onclick="changeData()">...</div>
 <script>
     function changeData() {
         let chart = document.getElementById("data");
         let elements = chart.children;
         let values = [5, 35, 15];
         for(let i = 0; i < values.length; i++) {
             let labelElement = elements[i].children[1].innerText =
             values[i];
             elements[i].children[1].style.background = "blue";
             elements[i].children[1].style.width = values[i] * 10 + "px";
         }
     }
 </script>
The following screenshot shows the same chart as the preceding one after clicking, with new colors and values:
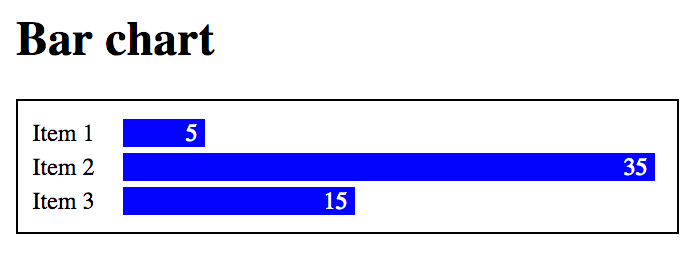
An interactive bar chart created with the standard DOM, CSS, HTML, and Javascript
But you don't have to use div and CSS to draw bars. Since HTML5, you can also use the Canvas API—a complete graphical library that can be used to create any kind of graphics, not just rectangles. The following example displays the same data as a pie chart using only standard HTML and no extra libraries:
<canvas id="chart" height="200" width="400"></canvas>

<script>
    const canvas = document.getElementById('chart');
    const ctx = canvas.getContext('2d');
    const rad = Math.min(canvas.height, canvas.width) / 2;

    const data = [100, 100, 100];
    const comp = n => Math.floor(Math.random() * 255);
    const colors = function() {
        return "rgba("+comp()+","+comp()+","+comp()+",0.5)";
    };

    let angle  = 0.0;
    let total  = data.reduce((a, b) => a + b, 0);

    for (var i = 0; i < data.length; i++) {
        ctx.fillStyle = colors();
        ctx.strokeStyle = 'white';
        ctx.lineWidth = 4;
        ctx.beginPath();
        ctx.moveTo(rad, rad);
        ctx.arc(rad, rad, rad, angle, angle +
               (Math.PI * 2 * (data[i]/total)), false);
        ctx.lineTo(rad, rad);
        ctx.fill();
        ctx.stroke();
        angle += Math.PI * 2 * (data[i] / total);
    }
</script>
You can download all these code examples from the GitHub repository for this chapter. See the last section for details. The result is shown as follows:
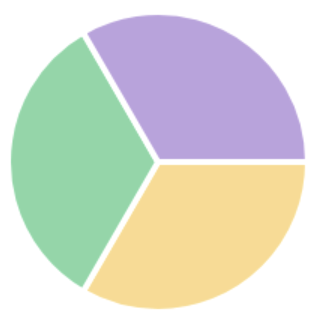
A simple pie chart created using HTML Canvas
You can make even nicer pie charts in Chart.js without writing a single line of Canvas code, and you won't have to worry about calculating angles in radians or adjusting scales to fit the page. You also get free tooltips with far fewer lines of code than we used previously. Chart.js may not satisfy all your data visualization needs, but it certainly is a great way to start. You can then apply your knowledge of HTML and JavaScript and extend it with plugins, integrate with other charting solutions, or migrate to a larger and unrestricted library such as D3.js.