

We ended the last recipe learning how to create one fourth of the flags of the world, but that can't be the end of it, can it? This recipe will be dedicated to using paths to create more complex shapes. We will start by creating a triangle and progress from there to more complicated shapes.
Let's start from the simplest shape that isn't included in the basic shapes library: a triangle. So if you're ready let's get started...
Let's start with creating our first shape, a triangle:
context.fillStyle = color;
context.beginPath();
context.moveTo(x1,y1);
context.lineTo(x2,y2);
context.lineTo(x3,y3);
context.lineTo(x1,y1);
context.closePath();
context.fill();
The code here with points x1,y1 through x3,y3 is pseudocode. You would need to pick your own points to create a triangle.
Most of the elements here aren't new. The most important change here is that we are creating the shape from scratch using the elements we worked with before. When we create a shape we always start by declaring it using the beginPath() method. We then create the shape and end the creation with the closePath() method. We will still not have anything visible on the screen until we decide what we want to do with the shape we created, such as show its fill or show its strokes. In this case as we are trying to create a triangle we will call the fill function.
Let's see this in action in a live flag sample. This time we will visit Mount Roraima in Guyana.
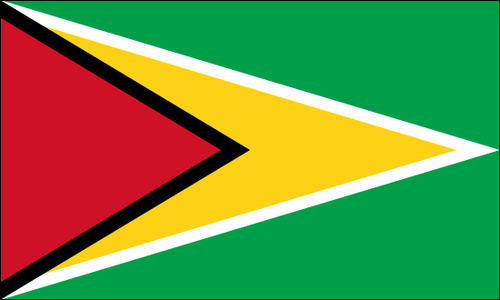
OK, so you get the idea of the triangle. Let's see this in action. I've extracted this code and put it into a function. To create this flag, we will need to create four triangles.
var canvas = document.getElementById("guyana");
var wid = canvas.width;
var hei = canvas.height;

var context = canvas.getContext("2d");
    context.fillStyle = "#009E49";
    context.fillRect(0,0,wid,hei);

fillTriangle(context,	0,0,
             wid,hei/2,
             0,hei, "#ffffff");
fillTriangle(context,0,10,
             wid-25,hei/2,
             0,hei-10, "#FCD116");
fillTriangle(context,0,0,
             wid/2,hei/2,
             0,hei, "#000000");
fillTriangle(context,0,10,
             wid/2-16,hei/2,
             0,hei-10, "#CE1126");

function fillTriangle(context,x1,y1,x2,y2,x3,y3,color){
  context.fillStyle = color;
  context.beginPath();
  context.moveTo(x1,y1);
  context.lineTo(x2,y2);
  context.lineTo(x3,y3);
  context.lineTo(x1,y1);
  context.closePath();
  context.fill();
}
By creating the fillTriangle() function we can now quickly and effectively create triangles just as we created rectangles. This function makes it a breeze to create a flag with such a rich numbers of triangles. Now, with the help of the fillTriangle method we can create any flag in the world that has triangles in it.
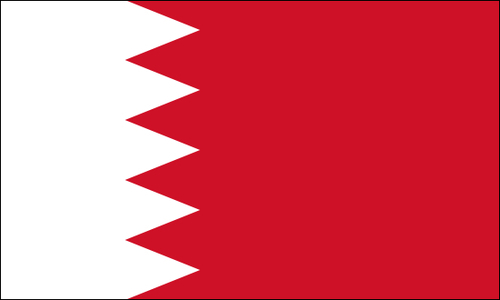
Don't let triangles be your most complex shape, as you can create any number of pointed shapes. Let's create a more complex zigzag pattern. To do so, we will fly over to the Kingdom of Bahrain.
Try to locate the new logic before we break it down and explain it.
var canvas = document.getElementById("bahrain");
var wid = canvas.width;
var hei = canvas.height;

var context = canvas.getContext("2d");
    context.fillStyle = "#CE1126";
    context.fillRect(0,0,wid,hei);
var baseX = wid*.25;
    context.fillStyle = "#ffffff";
    context.beginPath();
    context.lineTo(baseX,0);

var zagHeight = hei/5;
for(var i=0; i<5; i++){
  context.lineTo(baseX +25 , (i+.5)*zagHeight);
  context.lineTo(baseX  , (i+1)*zagHeight);

}
context.lineTo(0,hei);
context.lineTo(0,0);
context.closePath();
context.fill();

addBoarder(context,wid,hei);
Let's break down this zigzag and understand what's going on here. After starting up with our normal setting up of a canvas element, we jump right into creating our shape. We start by drawing a red background, leaving us to create a shape that will have the white area. It's very much like a rectangle except that it has zigzags in it.
In this code, we start by creating a rectangle but our goal will be to change the highlighted code line with zigzags:
var baseX = wid*.25;
context.fillStyle = "#ffffff";
context.beginPath();
context.lineTo(baseX,0);
context.lineTo(wid*.25,hei);
context.lineTo(0,hei);
context.lineTo(0,0);
context.closePath();
context.fill();
In this code we set the fill color to white, we set our beginPath and then lineTo (starting at the point (0,0), the default starting point) and create a rectangle that fills 25 percent of the width of the canvas. I've highlighted the horizontal line as this is the one we want to make zigzags with. By looking at the flag we can see that we are going to create five triangles going across the screen, so let's switch this line with a for loop:
...
context.lineTo(baseX,0);

var zagHeight = hei/5;
for(var i=0; i<5; i++){
  context.lineTo(baseX +25 , (i+.5)*zagHeight);
  context.lineTo(baseX  , (i+1)*zagHeight);

}

context.lineTo(0,hei);
  ...
So our first step before we can run through the loop is to decide how tall each triangle will be:
var zagHeight = hei/5;
We take the total height of the canvas and divide it by five to give us the height for each triangle.
We draw the zigzags in the for loop itself. To do so we need to use the following two lines of code in each round:
context.lineTo(baseX +25 , (i+.5)*zagHeight);
context.lineTo(baseX  , (i+1)*zagHeight);
In the first line we step away from the current position and expand the line out half way through the height of the triangle, and to the extreme point on the right; and then on the second line we return back to the starting x point and update our y to the starting point of the next line segment. By the way, the addition of baseX +25 is totally arbitrary. I just played with it until it looked good, but if you want you could use ratios instead (that way if you expand the canvas it would still look good).
The most amazing part of all of this is just knowing how to create some zigzags, triangles, rectangles, and circles. You can create an even larger number of flags but we are not done yet. Our quest to know how to create all the flags of the world continues.
If you are new to drawing via code or feel you can use some extra practice, just look at the map of the world and challenge yourself to create flags based on the skills we built already.