

All we need to do in order to profile our application is right-click on it in the Projects window and select Profile. At that point, the following window will pop up:
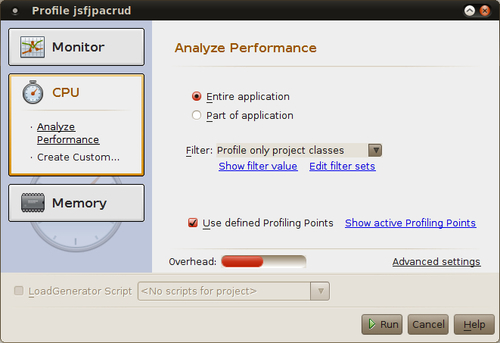
As we can see, there are several aspects of our application we can profile, such as memory allocation and CPU usage. One of the most useful features of the NetBeans profiler is the ability to report how long each method invocation in our application is taking, this information is provided when we profile CPU usage.
In order to start profiling, we simply click on the Run button. At this point the application server will be started in profiling mode, and our application will be deployed and executed. After a few seconds the Profiler control panel will open.
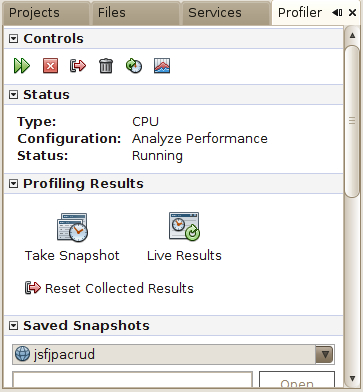
At this point we can see how long each method is taking and how many times each method has been executed by simply clicking on the Live Results button.
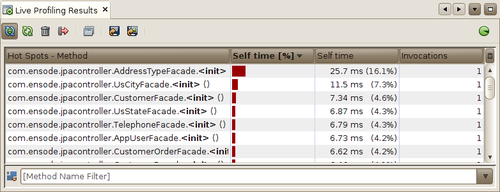
The Live Profiling Results window displays every method invocation, along with the percentage of total time in the application that the method is using, and the number of milliseconds the method takes to complete, it also shows how many times each method has been invoked.
As we can see, the NetBeans profiler can be very helpful in pinpointing areas of our application that are having performance problems, allowing us to easily identify these areas so that we can better focus our performance optimization efforts.
Although this information is very valuable, it is by no means the only information we can obtain from the NetBeans profiler. We can see how much memory our application is using by simply opening the VM Telemetry Overview window by clicking on the VM Telemetry icon on the Profiling control panel.
After clicking the VM Telemetry Icon, the VM Telemetry window opens. This window has three tabs:
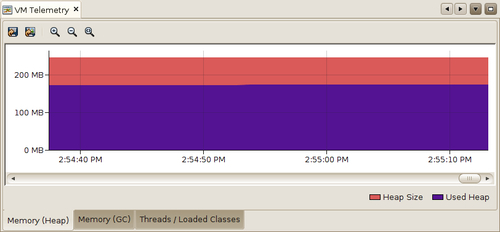
The graph on the left tab shows (in red) the total amount of heap allocated in our application's Java Virtual Machine. Additionally, it also shows the total amount of heap used by our application.
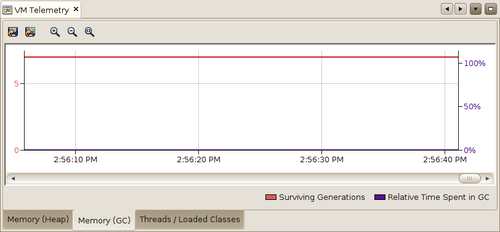
The graph in the middle tab is useful for detecting "memory leaks" (Java has garbage collection, therefore in theory memory leaks are impossible. However, if we keep references to objects that are no longer needed they are never garbage collected, therefore a memory leak is possible). The purple line in the middle graph indicates the amount of time the JVM spends doing garbage collection. The red line indicates Surviving Generations . A generation is a set of objects that were created within two garbage collection intervals. A surviving generation is a generation that survived one or more garbage collections. We can force our application to garbage collect by clicking on the icon in the Profiling control panel:

If the graph indicates a high number of surviving generations between garbage collections, then we might have a memory leak in our application.
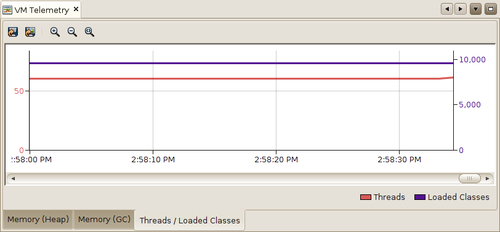
The graph on the right tab of the VM Telemetry Overview window indicates the number of active threads and the number of loaded classes in our application.