Now that Instaview has successfully blended our clickstream and geographic data, let’s visualize the data on a Google map:
Make sure you are connected to the Internet so the Google mapping feature will work.
If you are in the Instaview Configure mode instead of the analysis interface, click on the New Analysis button.
Drag
Durationsessionto the Measures drop zone in the Layout section.Drag
Countryto the Rows drop zone in the Layout section.Drag
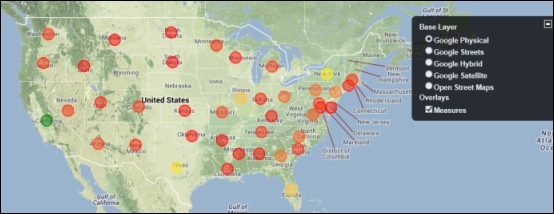
Stateto the Rows drop zone in the Layout section.In the View As section, click on the dropdown next to the chart icon and then select Geo Map:

Expand the small plus icon on the right-hand side of the map and select the Google Physical base layer so that your visualization matches the following screenshot: