Book Image

Advanced Analytics with R and Tableau

By : Ruben Oliva Ramos, Jen Stirrup, Roberto Rösler
Book Image

Advanced Analytics with R and Tableau

By: Ruben Oliva Ramos, Jen Stirrup, Roberto Rösler

Overview of this book

Tableau and R offer accessible analytics by allowing a combination of easy-to-use data visualization along with industry-standard, robust statistical computation. Moving from data visualization into deeper, more advanced analytics? This book will intensify data skills for data viz-savvy users who want to move into analytics and data science in order to enhance their businesses by harnessing the analytical power of R and the stunning visualization capabilities of Tableau. Readers will come across a wide range of machine learning algorithms and learn how descriptive, prescriptive, predictive, and visually appealing analytical solutions can be designed with R and Tableau. In order to maximize learning, hands-on examples will ease the transition from being a data-savvy user to a data analyst using sound statistical tools to perform advanced analytics. By the end of this book, you will get to grips with advanced calculations in R and Tableau for analytics and prediction with the help of use cases and hands-on examples.
Table of Contents (16 chapters)
Advanced Analytics with R and Tableau
Credits
About the Authors
About the Reviewers
www.PacktPub.com
Customer Feedback
Preface
Index

Clustering without using k-means


Now, Tableau can only do k-Means clustering. On the other hand, R can offer a variety of other clustering methodologies, such as hierarchical clustering.

In this topic, we will look at how R can do other types of clustering, which completes the picture of clustering in Tableau.

Hierarchical modeling

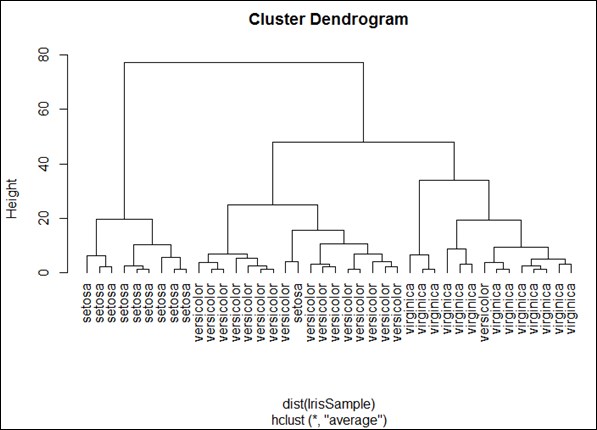
Hierarchical modeling is aimed at finding hierarchies of clusters. This facility is available to us in R. To do this, let's use the Iris dataset with an R script, which will focus on hierarchical clustering. The script is as follows:

IrisSample <- sample(1:dim(iris)[1],40)
IrisSample$Species <- NULL

dim(IrisSample)
hc <- hclust(dist(IrisSample), method="ave")
hc

plot(hc, hang = -1, labels=iris$Species[IrisSample])

In the following figure we can represent a cluster dendogram, which means the hierarchies of clusters.