Book Image

TensorFlow Machine Learning Cookbook

By : Nick McClure
Book Image

TensorFlow Machine Learning Cookbook

By: Nick McClure

Overview of this book

TensorFlow is an open source software library for Machine Intelligence. The independent recipes in this book will teach you how to use TensorFlow for complex data computations and will let you dig deeper and gain more insights into your data than ever before. You’ll work through recipes on training models, model evaluation, sentiment analysis, regression analysis, clustering analysis, artificial neural networks, and deep learning – each using Google’s machine learning library TensorFlow. This guide starts with the fundamentals of the TensorFlow library which includes variables, matrices, and various data sources. Moving ahead, you will get hands-on experience with Linear Regression techniques with TensorFlow. The next chapters cover important high-level concepts such as neural networks, CNN, RNN, and NLP. Once you are familiar and comfortable with the TensorFlow ecosystem, the last chapter will show you how to take it to production.
Table of Contents (19 chapters)
TensorFlow Machine Learning Cookbook
Credits
About the Author
About the Reviewer
www.PacktPub.com
Customer Feedback
Preface
Index

Operations in a Computational Graph


Now that we can put objects into our computational graph, we will introduce operations that act on such objects.

Getting ready

To start a graph, we load TensorFlow and create a session, as follows:

import tensorflow as tf
sess = tf.Session()

How to do it…

In this example, we will combine what we have learned and feed in each number in a list to an operation in a graph and print the output:

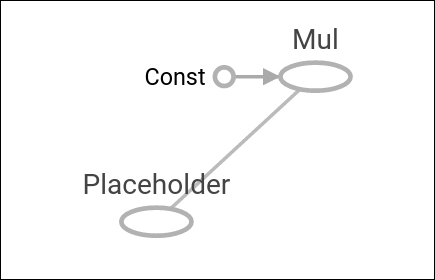
  1. First we declare our tensors and placeholders. Here we will create a numpy array to feed into our operation:

    import numpy as np
    x_vals = np.array([1., 3., 5., 7., 9.])
    x_data = tf.placeholder(tf.float32)
    m_const = tf.constant(3.)
    my_product = tf.mul(x_data, m_const)
    for x_val in x_vals:
        print(sess.run(my_product, feed_dict={x_data: x_val}))
    3.0
    9.0
    15.0
    21.0
    27.0

How it works…

Steps 1 and 2 create the data and operations on the computational graph. Then, in step 3, we feed the data through the graph and print the output. Here is what the computational graph looks like:

Figure...