
In this chapter, you will learn how to write mining codes for stream data, time-series data, and sequence data.
The characteristics of stream, time-series, and sequence data are unique, that is, large and endless. It is too large to get an exact result; this means an approximate result will be achieved. The classic data-mining algorithm should be extended, or a new algorithm needs to be designed for this type of the dataset.
In relation to the mining of stream, time-series, and sequence data, there are some topics we can't avoid. They are association, frequent pattern, classification and clustering algorithms, and so on. In the following sections, we will go through these major topics.
In this chapter, we will cover the following topics;
- The credit card transaction flow and STREAM algorithm
- Predicting future prices and time-series analysis
- Stock market data and time-series clustering and classification
- Web click streams and mining symbolic sequences
- Mining sequence patterns in transactional databases
As we mentioned in the previous chapters, one kind of data source always requires a variety of predefined algorithms or a brand new algorithm to deal with. Streaming data behaves a bit different from a traditional dataset.
The streaming dataset comes from various sources in modern life, such as credit record transaction stream, web feeds, phone-call records, sensor data from a satellite or radar, network traffic data, a security event's stream, and a long running list of various data streams.
The targets to stream data processing are, and not limited to, summarization of the stream to specific extents.
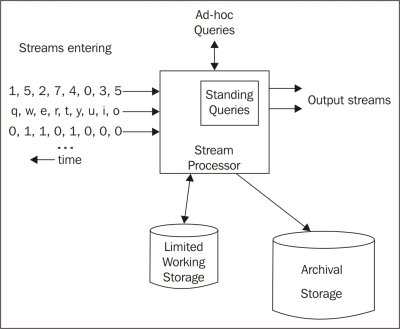
With the characteristics of streaming data, the typical architecture to stream a management system is illustrated in the following diagram:
The STREAM algorithm is a classical algorithm used to cluster stream data. In the next section, the details are present and explained by R code.
The summarized pseudocode of the STREAM algorithm are as follows:

In the preceding algorithm, LOCALSEARCH is a revised k-median algorithm.


Please take a look at the R codes file ch_08_stream.R from the bundle of R codes for previously mentioned algorithms. The codes can be tested with the following command:
> source("ch_08_stream.R")
Day by day, the growing e-commerce market is driving the growth of the usage of credit card, which, in turn, is bringing in a large number of transaction streams. Fraudulent usage of credit cards happens every day; we want the algorithm to detect this kind of transaction in a very short time compared to the big volume of transactions. Besides this, the requirement to find out the valuable customers by an analysis of the transaction streams is becoming more and more important. However, it is harder to get valid information in a very short time in response to the advertisement needs, such as recommend the necessary finance services or goods to these customers.
The credit card transaction flow is also the process to generate stream data, and the related stream-mining algorithm can be applied with high accuracy.
One application for the credit card transaction flow mining is the behavior analysis of the consumers. With each transaction record that is stored, various costs or purchases of a certain person can be tracked. With the mining of such transaction records, we can provide an analysis to the credit card holder to help them keep financial balance or other financial target. We can also provide this analysis to the card issuer that published the credit card to create a new business, such as funding or loaning, or to the retailers (the merchants) such as Walmart to help in the arrangement of appropriate goods.
Another application for the credit card transaction flow mining is fraud detection. It is the most obvious one among tons of applications. Using this solution, the card issuer or the bank can reduce the rate of successful fraud.
The dataset of the credit card transaction includes the owner of cards, place of consumption, date, cost, and so on.
Auto Regressive Integrated Moving Average (ARIMA) is a classic algorithm to analyze time–series data. As the initial step, an ARIMA model will be chosen to model the time-series data. Assuming that  is a time-series variable such as a price, the formula is defined as follows, and it includes the main features of the variable:


Predicting future prices is one subproblem of predicting the future; this is just a sign of the difficulty of this issue. Another similar issue under this domain is estimating the future market demands.
The stock market is a good example of predicting the future price; here, the prices changes along with time. Predicting future prices helps estimate the equity returns in the future and also helps in deciding the timing for financial investors, such as when to buy/sell.
The price graph shows an oscillation. Many factors can affect this value, even the psycology of humans.
The key problem in this prediction is the huge data volume. As a direct result, the algorithms to be used for this topic need to be efficient. The other key problem is that the price might change dramatically in a short time. Also, the complexity of the market is definitely a big problem.
The data instances for the future price prediction include quantitative attributes such as technical factors, and they also include macroeconomics, microeconomics, political events, and investor expectations. Moreover, they include the domain expert's knowledge.
All the solutions based on the aggregate disperse information from the preselected factors.
Price is obviously affected by time, and is a time-series variable too. To forecast the future value, the time-series-analysis algorithm will apply. ARIMA can be used to forecast the prices of the next day.
One classical solution is to determine the trends of the market at a very early stage. Another solution is fuzzy solutions, which is also a good choice because of the huge volume of dataset and wide range of factors affecting the prices.
The ARIMA algorithm
Predicting future prices is one subproblem of predicting the future; this is just a sign of the difficulty of this issue. Another similar issue under this domain is estimating the future market demands.
The stock market is a good example of predicting the future price; here, the prices changes along with time. Predicting future prices helps estimate the equity returns in the future and also helps in deciding the timing for financial investors, such as when to buy/sell.
The price graph shows an oscillation. Many factors can affect this value, even the psycology of humans.
The key problem in this prediction is the huge data volume. As a direct result, the algorithms to be used for this topic need to be efficient. The other key problem is that the price might change dramatically in a short time. Also, the complexity of the market is definitely a big problem.
The data instances for the future price prediction include quantitative attributes such as technical factors, and they also include macroeconomics, microeconomics, political events, and investor expectations. Moreover, they include the domain expert's knowledge.
All the solutions based on the aggregate disperse information from the preselected factors.
Price is obviously affected by time, and is a time-series variable too. To forecast the future value, the time-series-analysis algorithm will apply. ARIMA can be used to forecast the prices of the next day.
One classical solution is to determine the trends of the market at a very early stage. Another solution is fuzzy solutions, which is also a good choice because of the huge volume of dataset and wide range of factors affecting the prices.
Predicting future prices
Predicting future prices is one subproblem of predicting the future; this is just a sign of the difficulty of this issue. Another similar issue under this domain is estimating the future market demands.
The stock market is a good example of predicting the future price; here, the prices changes along with time. Predicting future prices helps estimate the equity returns in the future and also helps in deciding the timing for financial investors, such as when to buy/sell.
The price graph shows an oscillation. Many factors can affect this value, even the psycology of humans.
The key problem in this prediction is the huge data volume. As a direct result, the algorithms to be used for this topic need to be efficient. The other key problem is that the price might change dramatically in a short time. Also, the complexity of the market is definitely a big problem.
The data instances for the future price prediction include quantitative attributes such as technical factors, and they also include macroeconomics, microeconomics, political events, and investor expectations. Moreover, they include the domain expert's knowledge.
All the solutions based on the aggregate disperse information from the preselected factors.
Price is obviously affected by time, and is a time-series variable too. To forecast the future value, the time-series-analysis algorithm will apply. ARIMA can be used to forecast the prices of the next day.
One classical solution is to determine the trends of the market at a very early stage. Another solution is fuzzy solutions, which is also a good choice because of the huge volume of dataset and wide range of factors affecting the prices.
Time-series clustering has been proven to provide effective information for further research. In contrast to the classic clustering, the time-series dataset comprises data changed with time.

This algorithm is denoted as "clustering seasonality patterns in the presence of errors"; the summarized algorithm is listed in the following figure. The major characteristic of this algorithm is to introduce a specific distance function and a dissimilarity function.

Please take a look at the R codes file ch_08_herror.R from the bundle of R codes for previously mentioned algorithms. The codes can be tested with the following command:
> source("ch_08_herror.R")
Stock market is a complex dynamic system, and many factors can affect the market. For example, breaking financial news is also a key factor for this topic.
The characteristics of stock market data are large volume (near infinite), real time, high dimensions, and high complexity. The various data streams from stock markets go along with many events and correlations.
Stock market sentiment analysis is one topic related to this domain. The stock market is too complex with many factors that can affect the market. People's opinion or sentiment is one of the major factors.
The real-time information needs from the stock market require the fast, efficient online-mining algorithms. The time-series data accounts for various data including the stock market data that updates along with time.
To predict the stock market, the past data is really important. Using the past return on certain stock, the future price of that stock can be predicted based on the price-data stream.
The hError algorithm
This algorithm is denoted as "clustering seasonality patterns in the presence of errors"; the summarized algorithm is listed in the following figure. The major characteristic of this algorithm is to introduce a specific distance function and a dissimilarity function.
Please take a look at the R codes file ch_08_herror.R from the bundle of R codes for previously mentioned algorithms. The codes can be tested with the following command:
> source("ch_08_herror.R")
Stock market is a complex dynamic system, and many factors can affect the market. For example, breaking financial news is also a key factor for this topic.
The characteristics of stock market data are large volume (near infinite), real time, high dimensions, and high complexity. The various data streams from stock markets go along with many events and correlations.
Stock market sentiment analysis is one topic related to this domain. The stock market is too complex with many factors that can affect the market. People's opinion or sentiment is one of the major factors.
The real-time information needs from the stock market require the fast, efficient online-mining algorithms. The time-series data accounts for various data including the stock market data that updates along with time.
To predict the stock market, the past data is really important. Using the past return on certain stock, the future price of that stock can be predicted based on the price-data stream.
Time-series classification with the 1NN classifier
The summarized pseudocode for the 1NN classifier algorithm is as follows:

Please take a look at the R codes file ch_08_herror.R from the bundle of R codes for previously mentioned algorithms. The codes can be tested with the following command:
> source("ch_08_herror.R")
Stock market is a complex dynamic system, and many factors can affect the market. For example, breaking financial news is also a key factor for this topic.
The characteristics of stock market data are large volume (near infinite), real time, high dimensions, and high complexity. The various data streams from stock markets go along with many events and correlations.
Stock market sentiment analysis is one topic related to this domain. The stock market is too complex with many factors that can affect the market. People's opinion or sentiment is one of the major factors.
The real-time information needs from the stock market require the fast, efficient online-mining algorithms. The time-series data accounts for various data including the stock market data that updates along with time.
To predict the stock market, the past data is really important. Using the past return on certain stock, the future price of that stock can be predicted based on the price-data stream.
The R implementation
Please take a look at the R codes file ch_08_herror.R from the bundle of R codes for previously mentioned algorithms. The codes can be tested with the following command:
> source("ch_08_herror.R")
Stock market is a complex dynamic system, and many factors can affect the market. For example, breaking financial news is also a key factor for this topic.
The characteristics of stock market data are large volume (near infinite), real time, high dimensions, and high complexity. The various data streams from stock markets go along with many events and correlations.
Stock market sentiment analysis is one topic related to this domain. The stock market is too complex with many factors that can affect the market. People's opinion or sentiment is one of the major factors.
The real-time information needs from the stock market require the fast, efficient online-mining algorithms. The time-series data accounts for various data including the stock market data that updates along with time.
To predict the stock market, the past data is really important. Using the past return on certain stock, the future price of that stock can be predicted based on the price-data stream.
Stock market data
Stock market is a complex dynamic system, and many factors can affect the market. For example, breaking financial news is also a key factor for this topic.
The characteristics of stock market data are large volume (near infinite), real time, high dimensions, and high complexity. The various data streams from stock markets go along with many events and correlations.
Stock market sentiment analysis is one topic related to this domain. The stock market is too complex with many factors that can affect the market. People's opinion or sentiment is one of the major factors.
The real-time information needs from the stock market require the fast, efficient online-mining algorithms. The time-series data accounts for various data including the stock market data that updates along with time.
To predict the stock market, the past data is really important. Using the past return on certain stock, the future price of that stock can be predicted based on the price-data stream.
Web click streams data is large and continuously emerging, with hidden trends buried and to be discovered for various usages, such as recommendations. TECNO-STREAMS (Tracking Evolving Clusters in NOisy Streams) is a one-pass algorithm.
The whole algorithm is modeled on the following equations: the robust weight or activation function (1), influence zone (2), pure simulation (3), optimal scale update (4), incremental update of pure simulation and optimal update (5) and (6), the simulation and scale values (7), and finally, the D-W-B-cell update equations (8).


The similarity measures applied in the learning phase are defined here:


The similarity measures applied in the validation phase are defined here:


The summarized pseudocode for the TECNO-STREAMS algorithm is as follows:

Please take a look at the R codes file ch_08_tecno_stream.R from the bundle of R codes for previous algorithm. The codes can be tested with the following command:
> source("ch_08_tecno_stream.R")
The web click streams denote the user's behavior when visiting the site, especially for e-commerce sites and CRM (Customer Relation Management). The analysis of web click streams will improve the user experience of the customer and optimize the structure of the site to meet the customers' expectation and, finally, increase the income of the site.
In other aspects, web click streams mining can be used to detect DoS attacks, track the attackers, and prevent these on the Web in advance.
The dataset for web click stream is obviously the click records that get generated when the user visits various sites. The major characteristics of this dataset are that it is huge, and the size goes on increasing.
The TECNO-STREAMS algorithm
The whole algorithm is modeled on the following equations: the robust weight or activation function (1), influence zone (2), pure simulation (3), optimal scale update (4), incremental update of pure simulation and optimal update (5) and (6), the simulation and scale values (7), and finally, the D-W-B-cell update equations (8).
The similarity measures applied in the learning phase are defined here:
The similarity measures applied in the validation phase are defined here:
The summarized pseudocode for the TECNO-STREAMS algorithm is as follows:
Please take a look at the R codes file ch_08_tecno_stream.R from the bundle of R codes for previous algorithm. The codes can be tested with the following command:
> source("ch_08_tecno_stream.R")
The web click streams denote the user's behavior when visiting the site, especially for e-commerce sites and CRM (Customer Relation Management). The analysis of web click streams will improve the user experience of the customer and optimize the structure of the site to meet the customers' expectation and, finally, increase the income of the site.
In other aspects, web click streams mining can be used to detect DoS attacks, track the attackers, and prevent these on the Web in advance.
The dataset for web click stream is obviously the click records that get generated when the user visits various sites. The major characteristics of this dataset are that it is huge, and the size goes on increasing.
The R implementation
Please take a look at the R codes file ch_08_tecno_stream.R from the bundle of R codes for previous algorithm. The codes can be tested with the following command:
> source("ch_08_tecno_stream.R")
The web click streams denote the user's behavior when visiting the site, especially for e-commerce sites and CRM (Customer Relation Management). The analysis of web click streams will improve the user experience of the customer and optimize the structure of the site to meet the customers' expectation and, finally, increase the income of the site.
In other aspects, web click streams mining can be used to detect DoS attacks, track the attackers, and prevent these on the Web in advance.
The dataset for web click stream is obviously the click records that get generated when the user visits various sites. The major characteristics of this dataset are that it is huge, and the size goes on increasing.
Web click streams
The web click streams denote the user's behavior when visiting the site, especially for e-commerce sites and CRM (Customer Relation Management). The analysis of web click streams will improve the user experience of the customer and optimize the structure of the site to meet the customers' expectation and, finally, increase the income of the site.
In other aspects, web click streams mining can be used to detect DoS attacks, track the attackers, and prevent these on the Web in advance.
The dataset for web click stream is obviously the click records that get generated when the user visits various sites. The major characteristics of this dataset are that it is huge, and the size goes on increasing.
Mining sequence patterns can be thought of as association discovery over the temporal data or sequence dataset. Similarly, the classic pattern-mining algorithm should be extended or modified as per the sequence dataset's scenario.

Here are some questions for you to know whether you have understood the concepts:
- What is a stream?
- What is a time series?
- What is a sequence?