
Clustering is defined as an unsupervised classification of a dataset. The objective of the clustering algorithm is to divide the given dataset (a set of points or objects) into groups of data instances or objects (or points) with distance or probabilistic measures. Members in the same groups are closer by distance or similarity or by other measures. In other words, maximize the similarity of the intracluster (internal homogeneity) and minimize the similarity of the intercluster (external separation).
In this chapter, you will learn how to implement the top algorithms for clusters with R; these algorithms are listed here:
- Search engine and the k-means algorithm
- Automatic abstracting of document texts and the k-medoids algorithm
- The CLARA algorithm
- CLARANS
- Unsupervised image categorization and affinity propagation clustering
- Web page clustering and spectral clustering
- News categorization and hierarchical clustering
A clustering algorithm is used for the preparation of further analysis, while the other objective is to understand the nature of the dataset. The most common clustering process is illustrated in the following diagram:

The key steps in this process include the following:
- Feature selection: This step chooses distinguished features from the original dataset
- Clustering algorithm design: This step designs an appropriate algorithm based on the currently available clustering algorithms, or it just builds one from scratch
- Cluster validation: This step evaluates the clusters and provides a degree of confidence about the result
- Result interpretation: This step gives an intrinsic idea of the input dataset
There are many categorization methods to categorize clustering algorithms; the major categories are partition-based methods, density-based methods, hierarchical methods, spectral methods, grid-based methods, and so on.
Every clustering algorithm has its limitations and best practices for certain conditions or datasets. Once an algorithm is chosen, the parameters and distance measures (only for some algorithms) related to that algorithm need careful consideration as well. Then, we will list the most popular clustering algorithms and their corresponding parallel versions (if available).
Here is the short list of clustering algorithms and their complexities:
|
Cluster algorithm |
Capability of tracking high dimensional data |
|---|---|
|
k-means |
No |
|
Fuzzy c-means |
No |
|
Hierarchical clustering |
No |
|
CLARA |
No |
|
CLARANS |
No |
|
BIRCH |
No |
|
DBSCAN |
No |
|
CURE |
Yes |
|
WaveCluster |
No |
|
DENCLUE |
Yes |
|
FC |
Yes |
|
CLIQUE |
Yes |
|
OptiGrid |
Yes |
|
ORCLUS |
Yes |
The difficulties or targets in another aspect of clustering algorithms are the arbitrary shape of clusters, large volume of datasets, high-dimensional datasets, insensitivity to noise or outlier, low reliance to user-defined parameters, capability of dealing with new data without learning after the initial learning or clustering, sensitivity to the intrinsic, or nature of the number of clusters, nice data visualization, and application to both numeric or nominal data types.
The general process of partition-based clustering is iterative. The first step defines or chooses a predefined number of representatives of the cluster and updates the representative after each iteration if the measure for the clustering quality has improved. The following diagram shows the typical process, that is, the partition of the given dataset into disjoint clusters:

The characteristics of partition-based clustering methods are as follows:
- The resulting clusters are exclusive in most of the circumstances
- The shape of the clusters are spherical, because of most of the measures adopted are distance-based measures
- The representative of each cluster is usually the mean or medoid of the corresponding group (cluster) of points
- A partition represents a cluster
- These clusters are applicable for small-to-medium datasets
- The algorithm will converge under certain convergence object functions, and the result clusters are often local optimum
The k-means clustering algorithm is basically a greedy approach that defines the centroid of each cluster with its mean value. It is efficient for dealing with a large dataset. The k-means algorithm is a kind of exclusive clustering algorithm in which data is clustered in an exclusive way, and one object only belongs to, at the most, one group or cluster. It is also a type of partitional clustering algorithm in which clusters are created in one step, in contrast to a couple of steps.
The value of k is often determined by the domain knowledge, the dataset, and so on. At the start, k objects in the initial dataset D (the size of D is n, where  ) are randomly selected as the initial centers for the initial k clusters. In the iteration of the k-means algorithm, each object is assigned to the most similar or closest (various measures are used for distance or similarity) cluster (mean). Once the iteration ends, the mean for each cluster is updated or relocated. The k-means algorithm performs as much iteration as possible until there is no change that the clusters get from the previous clustering.
The quality of the specific cluster of the clustering algorithm is measured by various merits. One of them is formulated in the following equation. This is within the cluster variation measure, where  stands for the centroid of the cluster
  . Here, k is the number of clusters, whereas
  represents the Euclidean distance of the two points. The minimum value of E is the needed value and depicts the best quality clusters. This evaluation or assessing objective function serves as the ideal one, though not practical for concrete problems. The k-means algorithm provides easy methods for an approximate-to-ideal value. The k-means algorithm is also known as the squared error-based clustering algorithm.


In practice, the k-means algorithm can run several times with a different initial set of centroids to find a relatively better result.
The varieties of the k-means clustering algorithm are designed with different solutions for the selection of initial k centroids or means. The similarity or dissimilarity is measured, and the way to calculate the means is established.
The shortages of the k-means clustering method are listed as follows:
- The means of clusters must be defined with a function
- It is only applicable to numeric data type
- The value of k needs to be predefined by users, and it is difficult
The input parameters for a dual SVM algorithm is as follows:
- D, which is the set of training objects
- K

These parameters are used as depicted in the summarized pseudocodes of the k-means clustering algorithm given as follows:


This algorithm is a variant of the k-means algorithm; it can deal with categorical data types and large datasets. It can be integrated with the k-means method to deal with the clustering of the dataset that contains all data types. The algorithm is mentioned as follows:

Take a look at the ch_05_kmeans.R, ch_05_kernel_kmeans.R, and ch_05_kmedoids.R R code files from the bundle of R code for the previously mentioned algorithms. The code can be tested using the following commands:
> source("ch_05_kmeans.R") > source("ch_05_kernel_kmeans.R") > source("ch_05_kmedoids.R")


Along with the nonstop accumulation of Internet documents, the difficulties in finding some useful information keeps increasing. To find information in these documents or web pages or from the Web, four search methodologies are provided to us:
- The unassisted keyword search
- The assisted keyword search
- The directory-based search
- The query-by-example search
Web page clustering is an important preprocessing step to web data mining, which is one solution among the many possible solutions. The document clustering occurs in the progress of IR and text clustering. Many web clustering criteria are provided, such as the semantic, the structure, the usage-based criteria, and so on. Domain knowledge plays an important role in web page clustering.
Term Frequency-Inverse Document Frequency (TF-IDF) is applied during the preprocessing of the document dataset. One modeling method to represent a data instance for document clustering is the vector-space model. Given a term space, each dimension with a specific term in the documents and any document in the original document dataset can be represented by a vector, as depicted in the following equation. This definition implies that mostly, frequently used terms play an important role in the document:

Each value in a dimension denotes the frequency of the term that labels the dimension appearing in the document. For simplicity, the vector needs to be normalized as a unit length before processing it further, the stop words should be removed, and so on. As a potential and popular solution, the TF often weighs every term using the inverse document frequency among the document datasets. The inverse document frequency is denoted by the following formula in which n is the dataset size, and  is the document's number that contains the term,
  :
:

Given the definition of inverse document frequency, there is another popular definition of the vector model to denote a document in the document collection for further processing using a clustering algorithm;  is the frequency of term in the document
  :
:


The measures used in the document clustering are versatile and tremendous. Cosine method is one among them, and we will use the vector dot production in the equation while the corresponding centroid is defined as c in the successive equation:


Reuters-21578 is one publicly-available document dataset for further research. TREC-5, 6, and 7 are also open source datasets.
With this measure definition, the k-means algorithm is used for web page clustering, as it displays its efficiency and always acts as a component for a practical web search engine.
The k-medoids algorithm is extended from the k-means algorithm to decrease the sensitivity to the outlier data points.
Given the dataset D and the predefined parameter k, the k-medoids algorithm or the PAM algorithm can be described as shown in the upcoming paragraphs.
As per a clustering related to a set of k medoids, the quality is measured by the average distance between the members in each cluster and the corresponding representative or medoids.
An arbitrary selection of k objects from the initial dataset of objects is the first step to find the k medoids. In each step, for a selected object  and a nonselected node
  , if the quality of the cluster is improved as a result of swapping them, then a swap is performed.
The cluster quality should be the sum of all the differences in the distance between the members and medoids, before and after the swap. For each nonselected object , there are four difference cases under consideration (they are marked out in the following diagram). Given a set of medoids, one of them is , and the cluster related to it is  .
.

- Case 1: The first difference case is
 , given that
  is the representative of the second medoid that is closer or more similar to
  :
After swapping,
:
After swapping, will be relocated to
  , and the cost of swapping will be defined as follows:

- Case 2: The second difference case is ,
 .
After swapping, will be relocated to
.
After swapping, will be relocated to  , and the cost of swapping is defined as follows:

- Case 3: Here,
 and
and  . After swapping, the cost of swapping is defined as follows:

- Case 4: Here,
 and
and  . After swapping, will be relocated to, and the cost of swapping is defined as follows:

At the end of each swapping step, the total cost of swapping is defined as follows:

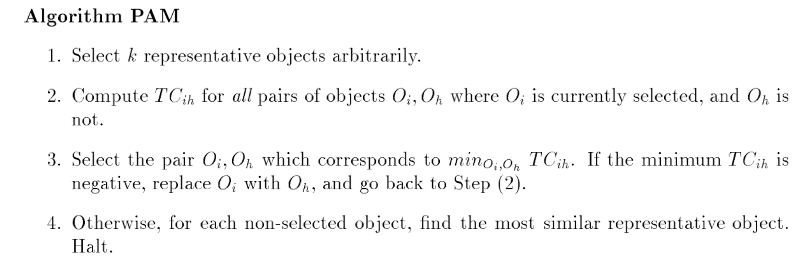
The PAM (Partitioning Around Medoids) algorithm is a partitional clustering algorithm. The summarized pseudocode for the PAM algorithm is as follows:
Take a look at the ch_05_kmedoids.R R code file from the bundle of R code for the previous algorithms. The code can be tested with the following command:
> source("ch_05_kmedoids.R")
Along with the increase in the size and quantity of documents on the Internet, the efficient algorithms are always in urgent need to get usable summarization or distill the key information. The documents will in versatile formats, structured or unstructured. The tasks include summarization of a single document or multiple documents. More extended target to extract summarization from multimedia files. Other challenges include summarizing multilingual documents. Abstraction requires the tool support from KNLP for grammar and lexicons for analyses and generation. One possible process for the abstraction is illustrated as follows:

Many approaches are suggested for automatic abstraction of document text, such as automatic extraction, automatic abstraction based on understanding, information extraction, and automatic abstraction based on structures. Possible features to be adapted to design the summarization system include the sentence length cutoff, fixed-phrase, paragraph, thematic word, and uppercase word features.
Abstraction or summarization popularly has been defined as a process with two steps. An intermediate representation of some sort is retrieved by the extraction of important concepts from the source texts. Given the intermediate representation, the summary is generated.
For the first step of the summarization process, it can largely be treated as part of automatic indexing. Lexical chains to extract important concepts from a document are one possible solution. Lexical chains exploit the cohesion among an arbitrary number of related words, and they are calculated by grouping (chaining) sets of words that are semantically related.
The PAM algorithm
The PAM (Partitioning Around Medoids) algorithm is a partitional clustering algorithm. The summarized pseudocode for the PAM algorithm is as follows:
Take a look at the ch_05_kmedoids.R R code file from the bundle of R code for the previous algorithms. The code can be tested with the following command:
> source("ch_05_kmedoids.R")
Along with the increase in the size and quantity of documents on the Internet, the efficient algorithms are always in urgent need to get usable summarization or distill the key information. The documents will in versatile formats, structured or unstructured. The tasks include summarization of a single document or multiple documents. More extended target to extract summarization from multimedia files. Other challenges include summarizing multilingual documents. Abstraction requires the tool support from KNLP for grammar and lexicons for analyses and generation. One possible process for the abstraction is illustrated as follows:
Many approaches are suggested for automatic abstraction of document text, such as automatic extraction, automatic abstraction based on understanding, information extraction, and automatic abstraction based on structures. Possible features to be adapted to design the summarization system include the sentence length cutoff, fixed-phrase, paragraph, thematic word, and uppercase word features.
Abstraction or summarization popularly has been defined as a process with two steps. An intermediate representation of some sort is retrieved by the extraction of important concepts from the source texts. Given the intermediate representation, the summary is generated.
For the first step of the summarization process, it can largely be treated as part of automatic indexing. Lexical chains to extract important concepts from a document are one possible solution. Lexical chains exploit the cohesion among an arbitrary number of related words, and they are calculated by grouping (chaining) sets of words that are semantically related.
The R implementation
Take a look at the ch_05_kmedoids.R R code file from the bundle of R code for the previous algorithms. The code can be tested with the following command:
> source("ch_05_kmedoids.R")
Along with the increase in the size and quantity of documents on the Internet, the efficient algorithms are always in urgent need to get usable summarization or distill the key information. The documents will in versatile formats, structured or unstructured. The tasks include summarization of a single document or multiple documents. More extended target to extract summarization from multimedia files. Other challenges include summarizing multilingual documents. Abstraction requires the tool support from KNLP for grammar and lexicons for analyses and generation. One possible process for the abstraction is illustrated as follows:
Many approaches are suggested for automatic abstraction of document text, such as automatic extraction, automatic abstraction based on understanding, information extraction, and automatic abstraction based on structures. Possible features to be adapted to design the summarization system include the sentence length cutoff, fixed-phrase, paragraph, thematic word, and uppercase word features.
Abstraction or summarization popularly has been defined as a process with two steps. An intermediate representation of some sort is retrieved by the extraction of important concepts from the source texts. Given the intermediate representation, the summary is generated.
For the first step of the summarization process, it can largely be treated as part of automatic indexing. Lexical chains to extract important concepts from a document are one possible solution. Lexical chains exploit the cohesion among an arbitrary number of related words, and they are calculated by grouping (chaining) sets of words that are semantically related.
Automatic abstraction and summarization of document text
Along with the increase in the size and quantity of documents on the Internet, the efficient algorithms are always in urgent need to get usable summarization or distill the key information. The documents will in versatile formats, structured or unstructured. The tasks include summarization of a single document or multiple documents. More extended target to extract summarization from multimedia files. Other challenges include summarizing multilingual documents. Abstraction requires the tool support from KNLP for grammar and lexicons for analyses and generation. One possible process for the abstraction is illustrated as follows:
Many approaches are suggested for automatic abstraction of document text, such as automatic extraction, automatic abstraction based on understanding, information extraction, and automatic abstraction based on structures. Possible features to be adapted to design the summarization system include the sentence length cutoff, fixed-phrase, paragraph, thematic word, and uppercase word features.
Abstraction or summarization popularly has been defined as a process with two steps. An intermediate representation of some sort is retrieved by the extraction of important concepts from the source texts. Given the intermediate representation, the summary is generated.
For the first step of the summarization process, it can largely be treated as part of automatic indexing. Lexical chains to extract important concepts from a document are one possible solution. Lexical chains exploit the cohesion among an arbitrary number of related words, and they are calculated by grouping (chaining) sets of words that are semantically related.
Instead of taking the whole set of data into consideration, the CLARA (Clustering LARge Application) algorithm randomly chooses a small portion of the actual data as a representative of the data. Medoids are then chosen from this sample using PAM. If the sample is selected in a fairly random manner, it should closely represent the original dataset.
CLARA draws multiple samples of the dataset, applies PAM to each sample, finds the medoids, and then returns its best clustering as the output. At first, a sample dataset D' is drawn from the original dataset D, and the PAM algorithm is applied to D' to find the k medoids. Use these k medoids and the dataset D to calculate the current dissimilarity. If it is smaller than the one you get in the previous iteration, then these k medoids are kept as the best k medoids. The whole process is performed a specified number of times.

CLARANS (Clustering Large Applications based on RANdomized Search) is efficient and effective and is the best practice for spatial data mining. CLARANS applies a strategy to search in a certain graph. A node in this graph, denoting it as  , is represented by a set of objects,
  ,
, . Here, k is the predefined value to choose the k medoids; as a result, the nodes in the graph are a set of
  . If two nodes,
  , and
, and  are neighbors, then
  . Each node in the graph represents a set of medoids and the cluster related to it. As a result, a cost is related to each node; this cost is the total distance between any objects and the medoid represents its cluster. The cost differential of two neighbors can be calculated with the cost measure function introduced in the PAM algorithm.

AP (Affinity Propagation) finds a set of exemplars,  , in the dataset and assigns nonselected points to the exemplars. An exemplar is the representative of a cluster.
Two types of messages are exchanged between data objects or points; they are explained here:
-
The r(i,k) message, which is called responsibility, represents the accumulated evidence sent from
 to
to  . It informs us that is suitable to serve as the exemplar of point . Every candidate is counted in.
-
The a(i,k) message, which is called availability, denotes the accumulated evidence sent from to . It informs us that should be the exemplar. Every support from other points is well considered.
Both r(i, k) and a(i,k) are initialized as 0 at the beginning of the algorithm:


 , for
, for s(k, k) is initialized with the same value (typically defined with heuristic knowledge) for each point at the start and updated in the following description to recur the affection. s(i, k) denotes the extent to which  is suited to be the exemplar of . Here is a possible value for
 s(i, i) to be set as a constant:


The index of exemplar,  , which is for data point
  , is defined with the following formula:
arg max {a(i,k) + r(i,k), k = 1,…, N}Given R = (r(i, j)) as the responsibility matrix and A = (a(i, j)) as the availability matrix, t represents the iteration counts, where a damping factor  is set to depress numerical oscillations that might arise:


Take a look at the ch_05_affinity_clustering.R R code file from the bundle of R code for the previously mentioned algorithms. The codes can be tested with the following command:
> source("ch_05_affinity_clustering.R")
Due to the massive number of images and other multimedia documents, the task to classify images becomes even harder than before. Unsupervised image categorization is frequently utilized by image and video summarization, or it just serves as a preprocessing step in supervised methods for classification.
One major issue related to unsupervised image categorization is to estimate the distribution of image categories. Further on, finding the most descriptive prototypes of the image categories is another main issue of image categorization.
Each image can be represented as a high-dimensional data instance, including features related to color, texture, and shape. The exemplar technique is applied here; it represents image categories by a small set of image or its fragments. Given exemplar concepts, the dimension of an image data instance reduces to a relatively small size and eases further processing. The measures applied here include the Chamfer, Hausdorff, and shuffle distances.
Natural categories of the dataset can be of various complex types; overlapping might be a frequent shape.
Unsupervised image categorization or classification is a clustering problem. Image clustering is to identify a set of similar image primitives, such as pixels, line elements, regions, and so on. Given the complex dataset, the recommended way is to use the prototype-based clustering algorithm. Affinity propagation algorithms can be applied to unsupervised categorization by finding a subset of representative exemplars.

Affinity propagation clustering
Affinity propagation itself is summarized as follows:

Take a look at the ch_05_affinity_clustering.R R code file from the bundle of R code for the previously mentioned algorithms. The codes can be tested with the following command:
> source("ch_05_affinity_clustering.R")
Due to the massive number of images and other multimedia documents, the task to classify images becomes even harder than before. Unsupervised image categorization is frequently utilized by image and video summarization, or it just serves as a preprocessing step in supervised methods for classification.
One major issue related to unsupervised image categorization is to estimate the distribution of image categories. Further on, finding the most descriptive prototypes of the image categories is another main issue of image categorization.
Each image can be represented as a high-dimensional data instance, including features related to color, texture, and shape. The exemplar technique is applied here; it represents image categories by a small set of image or its fragments. Given exemplar concepts, the dimension of an image data instance reduces to a relatively small size and eases further processing. The measures applied here include the Chamfer, Hausdorff, and shuffle distances.
Natural categories of the dataset can be of various complex types; overlapping might be a frequent shape.
Unsupervised image categorization or classification is a clustering problem. Image clustering is to identify a set of similar image primitives, such as pixels, line elements, regions, and so on. Given the complex dataset, the recommended way is to use the prototype-based clustering algorithm. Affinity propagation algorithms can be applied to unsupervised categorization by finding a subset of representative exemplars.
The R implementation
Take a look at the ch_05_affinity_clustering.R R code file from the bundle of R code for the previously mentioned algorithms. The codes can be tested with the following command:
> source("ch_05_affinity_clustering.R")
Due to the massive number of images and other multimedia documents, the task to classify images becomes even harder than before. Unsupervised image categorization is frequently utilized by image and video summarization, or it just serves as a preprocessing step in supervised methods for classification.
One major issue related to unsupervised image categorization is to estimate the distribution of image categories. Further on, finding the most descriptive prototypes of the image categories is another main issue of image categorization.
Each image can be represented as a high-dimensional data instance, including features related to color, texture, and shape. The exemplar technique is applied here; it represents image categories by a small set of image or its fragments. Given exemplar concepts, the dimension of an image data instance reduces to a relatively small size and eases further processing. The measures applied here include the Chamfer, Hausdorff, and shuffle distances.
Natural categories of the dataset can be of various complex types; overlapping might be a frequent shape.
Unsupervised image categorization or classification is a clustering problem. Image clustering is to identify a set of similar image primitives, such as pixels, line elements, regions, and so on. Given the complex dataset, the recommended way is to use the prototype-based clustering algorithm. Affinity propagation algorithms can be applied to unsupervised categorization by finding a subset of representative exemplars.
Unsupervised image categorization
Due to the massive number of images and other multimedia documents, the task to classify images becomes even harder than before. Unsupervised image categorization is frequently utilized by image and video summarization, or it just serves as a preprocessing step in supervised methods for classification.
One major issue related to unsupervised image categorization is to estimate the distribution of image categories. Further on, finding the most descriptive prototypes of the image categories is another main issue of image categorization.
Each image can be represented as a high-dimensional data instance, including features related to color, texture, and shape. The exemplar technique is applied here; it represents image categories by a small set of image or its fragments. Given exemplar concepts, the dimension of an image data instance reduces to a relatively small size and eases further processing. The measures applied here include the Chamfer, Hausdorff, and shuffle distances.
Natural categories of the dataset can be of various complex types; overlapping might be a frequent shape.
Unsupervised image categorization or classification is a clustering problem. Image clustering is to identify a set of similar image primitives, such as pixels, line elements, regions, and so on. Given the complex dataset, the recommended way is to use the prototype-based clustering algorithm. Affinity propagation algorithms can be applied to unsupervised categorization by finding a subset of representative exemplars.
Hierarchical clustering divides the target dataset into multilevels or a hierarchy of clusters. It segments data points along with successive partitions.
There are two strategies for hierarchical clustering. Agglomerative clustering starts with each data object in the input dataset as a cluster, and then in the following steps, clusters are merged according to certain similarity measures that end in only one cluster. Divisive clustering, in contrast, starts with one cluster with all the data objects in the input dataset as members, and then, the cluster splits according to certain similarity measures in the following steps, and at the end, singleton clusters of individual data objects are left.
The characteristics of hierarchical clustering methods are as follows:
- Multilevel decomposition.
- The merges or splits cannot perform a rollback. The error in the algorithm that is introduced by merging or splitting cannot be corrected.
- The hybrid algorithm.
The BIRCH (Balanced Iterative Reducing and Clustering using Hierarchies) algorithm is designed for large dynamic datasets and can also be applied to incremental and dynamic clustering. Only one pass of dataset is required, and this means that there is no need to read the whole dataset in advance.
CF-Tree
is a helper data structure that is used to store the summary of clusters, and it is also a representative of a cluster. Each node in the CF-Tree is declared as a list of entries,  , and
, and B is the predefined entry limitation.  denotes the link to the ith child.
Given  as the representative of cluster i, is defined as
  , where
  is the member count of the cluster, LS is the linear sum of the member objects, and SS is the squared sum of the member objects.
The leave of the CF-Tree must conform to the diameter limitation. The diameter of the  cluster must be less than the predefined threshold value, T.
The main helper algorithms in BIRCH are CF-Tree insertion and CF-Tree rebuilding.
The summarized pseudocode for the BIRCH algorithm is as follows:

The overall framework for the chameleon algorithm is illustrated in the following diagram:

There are three main steps in the chameleon algorithm, which are as follows:
- Sparsification: This step is to generate a k-Nearest Neighbor graph, which is derived from a proximity graph.
- Graph partitioning: This step applies a multilevel graph-partitioning algorithm to partition the dataset. The initial graph is an all-inclusive graph or cluster. This then bisects the largest graph in each successive step, and finally, we get a group of roughly, equally-sized clusters (with high intrasimilarity). Each resulting cluster has a size not more than a predefined size, that is,
MIN_SIZE. - Agglomerative hierarchical clustering: This last step is where the clusters are merged based on self-similarity. The notion of self-similarity is defined with the RI and RC; they can be combined in various ways to be a measure of self-similarity.
Relative Closeness (RC), given the  and
and  clusters with sizes
  and
and  , respectively.
  denotes the average weight of the edges that connect the two clusters.
  denotes the average weight of the edges that bisect the
  cluster:

Relative Interconnectivity (RI) is defined in the following equation. Here,  is the sum of the edges to connect the two clusters, and is the minimum sum of the cut edges that bisect the cluster:

The summarized pseudocode for the chameleon algorithm is as follows:

The probabilistic hierarchical clustering algorithm is a hybrid of hierarchical clustering and probabilistic clustering algorithms. As a probabilistic clustering algorithm, it applies a completely probabilistic approach, as depicted here:

Take a look at the ch_05_ahclustering.R R code file from the bundle of R code for the previously mentioned algorithms. The codes can be tested with the following command:
> source("ch_05_ahclustering.R")
News portals provide visitors with tremendous news categorized with a predefined set of topics. With the exponential growth of information we receive from the Internet, clustering technologies are widely used for web documents categorization, which include online news. These are often news streams or news feeds.
One advantage of a clustering algorithm for this task is that there is no need for prior domain knowledge. News can be summarized by clustering news that covers specific events. Unsupervised clustering can also play a pivotal role in discovering the intrinsic topical structure of the existing text collections, while new categorization is used to classify the documents according to a predefined set of classes.
Services such as Google News are provided. For a story published by a couple of new agencies or even the same agency, there are often various versions that exist at the same time or span the same range of days. Here, clustering can help aggregate the news related to the same story, and the result is a better overview of the current story for visitors.
As preprocessing steps, plain texts are extracted from the web pages or news pages. Reuters-22173 and -21578 are two popular documents dataset used for research. The representation of a data instance in the dataset can either be classical term-document vectors or term-sentence vectors, as the dataset is a collection of documents, and the cosine-like measures are applied here.
Agglomerative hierarchical clustering
The summarized pseudocode for the agglomerative hierarchical clustering algorithm is as follows:

The BIRCH (Balanced Iterative Reducing and Clustering using Hierarchies) algorithm is designed for large dynamic datasets and can also be applied to incremental and dynamic clustering. Only one pass of dataset is required, and this means that there is no need to read the whole dataset in advance.
CF-Tree
is a helper data structure that is used to store the summary of clusters, and it is also a representative of a cluster. Each node in the CF-Tree is declared as a list of entries, , and B is the predefined entry limitation. denotes the link to the ith child.
Given as the representative of cluster i, is defined as , where is the member count of the cluster, LS is the linear sum of the member objects, and SS is the squared sum of the member objects.
The leave of the CF-Tree must conform to the diameter limitation. The diameter of the cluster must be less than the predefined threshold value, T.
The main helper algorithms in BIRCH are CF-Tree insertion and CF-Tree rebuilding.
The summarized pseudocode for the BIRCH algorithm is as follows:
The overall framework for the chameleon algorithm is illustrated in the following diagram:
There are three main steps in the chameleon algorithm, which are as follows:
- Sparsification: This step is to generate a k-Nearest Neighbor graph, which is derived from a proximity graph.
- Graph partitioning: This step applies a multilevel graph-partitioning algorithm to partition the dataset. The initial graph is an all-inclusive graph or cluster. This then bisects the largest graph in each successive step, and finally, we get a group of roughly, equally-sized clusters (with high intrasimilarity). Each resulting cluster has a size not more than a predefined size, that is,
MIN_SIZE. - Agglomerative hierarchical clustering: This last step is where the clusters are merged based on self-similarity. The notion of self-similarity is defined with the RI and RC; they can be combined in various ways to be a measure of self-similarity.
Relative Closeness (RC), given the and clusters with sizes and , respectively. denotes the average weight of the edges that connect the two clusters. denotes the average weight of the edges that bisect the cluster:
Relative Interconnectivity (RI) is defined in the following equation. Here, is the sum of the edges to connect the two clusters, and is the minimum sum of the cut edges that bisect the cluster:
The summarized pseudocode for the chameleon algorithm is as follows:
The probabilistic hierarchical clustering algorithm is a hybrid of hierarchical clustering and probabilistic clustering algorithms. As a probabilistic clustering algorithm, it applies a completely probabilistic approach, as depicted here:
Take a look at the ch_05_ahclustering.R R code file from the bundle of R code for the previously mentioned algorithms. The codes can be tested with the following command:
> source("ch_05_ahclustering.R")
News portals provide visitors with tremendous news categorized with a predefined set of topics. With the exponential growth of information we receive from the Internet, clustering technologies are widely used for web documents categorization, which include online news. These are often news streams or news feeds.
One advantage of a clustering algorithm for this task is that there is no need for prior domain knowledge. News can be summarized by clustering news that covers specific events. Unsupervised clustering can also play a pivotal role in discovering the intrinsic topical structure of the existing text collections, while new categorization is used to classify the documents according to a predefined set of classes.
Services such as Google News are provided. For a story published by a couple of new agencies or even the same agency, there are often various versions that exist at the same time or span the same range of days. Here, clustering can help aggregate the news related to the same story, and the result is a better overview of the current story for visitors.
As preprocessing steps, plain texts are extracted from the web pages or news pages. Reuters-22173 and -21578 are two popular documents dataset used for research. The representation of a data instance in the dataset can either be classical term-document vectors or term-sentence vectors, as the dataset is a collection of documents, and the cosine-like measures are applied here.
The BIRCH algorithm
The BIRCH (Balanced Iterative Reducing and Clustering using Hierarchies) algorithm is designed for large dynamic datasets and can also be applied to incremental and dynamic clustering. Only one pass of dataset is required, and this means that there is no need to read the whole dataset in advance.
CF-Tree
is a helper data structure that is used to store the summary of clusters, and it is also a representative of a cluster. Each node in the CF-Tree is declared as a list of entries, , and B is the predefined entry limitation. denotes the link to the ith child.
Given as the representative of cluster i, is defined as , where is the member count of the cluster, LS is the linear sum of the member objects, and SS is the squared sum of the member objects.
The leave of the CF-Tree must conform to the diameter limitation. The diameter of the cluster must be less than the predefined threshold value, T.
The main helper algorithms in BIRCH are CF-Tree insertion and CF-Tree rebuilding.
The summarized pseudocode for the BIRCH algorithm is as follows:
The overall framework for the chameleon algorithm is illustrated in the following diagram:
There are three main steps in the chameleon algorithm, which are as follows:
- Sparsification: This step is to generate a k-Nearest Neighbor graph, which is derived from a proximity graph.
- Graph partitioning: This step applies a multilevel graph-partitioning algorithm to partition the dataset. The initial graph is an all-inclusive graph or cluster. This then bisects the largest graph in each successive step, and finally, we get a group of roughly, equally-sized clusters (with high intrasimilarity). Each resulting cluster has a size not more than a predefined size, that is,
MIN_SIZE. - Agglomerative hierarchical clustering: This last step is where the clusters are merged based on self-similarity. The notion of self-similarity is defined with the RI and RC; they can be combined in various ways to be a measure of self-similarity.
Relative Closeness (RC), given the and clusters with sizes and , respectively. denotes the average weight of the edges that connect the two clusters. denotes the average weight of the edges that bisect the cluster:
Relative Interconnectivity (RI) is defined in the following equation. Here, is the sum of the edges to connect the two clusters, and is the minimum sum of the cut edges that bisect the cluster:
The summarized pseudocode for the chameleon algorithm is as follows:
The probabilistic hierarchical clustering algorithm is a hybrid of hierarchical clustering and probabilistic clustering algorithms. As a probabilistic clustering algorithm, it applies a completely probabilistic approach, as depicted here:
Take a look at the ch_05_ahclustering.R R code file from the bundle of R code for the previously mentioned algorithms. The codes can be tested with the following command:
> source("ch_05_ahclustering.R")
News portals provide visitors with tremendous news categorized with a predefined set of topics. With the exponential growth of information we receive from the Internet, clustering technologies are widely used for web documents categorization, which include online news. These are often news streams or news feeds.
One advantage of a clustering algorithm for this task is that there is no need for prior domain knowledge. News can be summarized by clustering news that covers specific events. Unsupervised clustering can also play a pivotal role in discovering the intrinsic topical structure of the existing text collections, while new categorization is used to classify the documents according to a predefined set of classes.
Services such as Google News are provided. For a story published by a couple of new agencies or even the same agency, there are often various versions that exist at the same time or span the same range of days. Here, clustering can help aggregate the news related to the same story, and the result is a better overview of the current story for visitors.
As preprocessing steps, plain texts are extracted from the web pages or news pages. Reuters-22173 and -21578 are two popular documents dataset used for research. The representation of a data instance in the dataset can either be classical term-document vectors or term-sentence vectors, as the dataset is a collection of documents, and the cosine-like measures are applied here.
The chameleon algorithm
The overall framework for the chameleon algorithm is illustrated in the following diagram:
There are three main steps in the chameleon algorithm, which are as follows:
- Sparsification: This step is to generate a k-Nearest Neighbor graph, which is derived from a proximity graph.
- Graph partitioning: This step applies a multilevel graph-partitioning algorithm to partition the dataset. The initial graph is an all-inclusive graph or cluster. This then bisects the largest graph in each successive step, and finally, we get a group of roughly, equally-sized clusters (with high intrasimilarity). Each resulting cluster has a size not more than a predefined size, that is,
MIN_SIZE. - Agglomerative hierarchical clustering: This last step is where the clusters are merged based on self-similarity. The notion of self-similarity is defined with the RI and RC; they can be combined in various ways to be a measure of self-similarity.
Relative Closeness (RC), given the and clusters with sizes and , respectively. denotes the average weight of the edges that connect the two clusters. denotes the average weight of the edges that bisect the cluster:
Relative Interconnectivity (RI) is defined in the following equation. Here, is the sum of the edges to connect the two clusters, and is the minimum sum of the cut edges that bisect the cluster:
The summarized pseudocode for the chameleon algorithm is as follows:
The probabilistic hierarchical clustering algorithm is a hybrid of hierarchical clustering and probabilistic clustering algorithms. As a probabilistic clustering algorithm, it applies a completely probabilistic approach, as depicted here:
Take a look at the ch_05_ahclustering.R R code file from the bundle of R code for the previously mentioned algorithms. The codes can be tested with the following command:
> source("ch_05_ahclustering.R")
News portals provide visitors with tremendous news categorized with a predefined set of topics. With the exponential growth of information we receive from the Internet, clustering technologies are widely used for web documents categorization, which include online news. These are often news streams or news feeds.
One advantage of a clustering algorithm for this task is that there is no need for prior domain knowledge. News can be summarized by clustering news that covers specific events. Unsupervised clustering can also play a pivotal role in discovering the intrinsic topical structure of the existing text collections, while new categorization is used to classify the documents according to a predefined set of classes.
Services such as Google News are provided. For a story published by a couple of new agencies or even the same agency, there are often various versions that exist at the same time or span the same range of days. Here, clustering can help aggregate the news related to the same story, and the result is a better overview of the current story for visitors.
As preprocessing steps, plain texts are extracted from the web pages or news pages. Reuters-22173 and -21578 are two popular documents dataset used for research. The representation of a data instance in the dataset can either be classical term-document vectors or term-sentence vectors, as the dataset is a collection of documents, and the cosine-like measures are applied here.
The Bayesian hierarchical clustering algorithm
The summarized pseudocode for the Bayesian hierarchical clustering algorithm is as follows:

The probabilistic hierarchical clustering algorithm is a hybrid of hierarchical clustering and probabilistic clustering algorithms. As a probabilistic clustering algorithm, it applies a completely probabilistic approach, as depicted here:
Take a look at the ch_05_ahclustering.R R code file from the bundle of R code for the previously mentioned algorithms. The codes can be tested with the following command:
> source("ch_05_ahclustering.R")
News portals provide visitors with tremendous news categorized with a predefined set of topics. With the exponential growth of information we receive from the Internet, clustering technologies are widely used for web documents categorization, which include online news. These are often news streams or news feeds.
One advantage of a clustering algorithm for this task is that there is no need for prior domain knowledge. News can be summarized by clustering news that covers specific events. Unsupervised clustering can also play a pivotal role in discovering the intrinsic topical structure of the existing text collections, while new categorization is used to classify the documents according to a predefined set of classes.
Services such as Google News are provided. For a story published by a couple of new agencies or even the same agency, there are often various versions that exist at the same time or span the same range of days. Here, clustering can help aggregate the news related to the same story, and the result is a better overview of the current story for visitors.
As preprocessing steps, plain texts are extracted from the web pages or news pages. Reuters-22173 and -21578 are two popular documents dataset used for research. The representation of a data instance in the dataset can either be classical term-document vectors or term-sentence vectors, as the dataset is a collection of documents, and the cosine-like measures are applied here.
The probabilistic hierarchical clustering algorithm
The probabilistic hierarchical clustering algorithm is a hybrid of hierarchical clustering and probabilistic clustering algorithms. As a probabilistic clustering algorithm, it applies a completely probabilistic approach, as depicted here:
Take a look at the ch_05_ahclustering.R R code file from the bundle of R code for the previously mentioned algorithms. The codes can be tested with the following command:
> source("ch_05_ahclustering.R")
News portals provide visitors with tremendous news categorized with a predefined set of topics. With the exponential growth of information we receive from the Internet, clustering technologies are widely used for web documents categorization, which include online news. These are often news streams or news feeds.
One advantage of a clustering algorithm for this task is that there is no need for prior domain knowledge. News can be summarized by clustering news that covers specific events. Unsupervised clustering can also play a pivotal role in discovering the intrinsic topical structure of the existing text collections, while new categorization is used to classify the documents according to a predefined set of classes.
Services such as Google News are provided. For a story published by a couple of new agencies or even the same agency, there are often various versions that exist at the same time or span the same range of days. Here, clustering can help aggregate the news related to the same story, and the result is a better overview of the current story for visitors.
As preprocessing steps, plain texts are extracted from the web pages or news pages. Reuters-22173 and -21578 are two popular documents dataset used for research. The representation of a data instance in the dataset can either be classical term-document vectors or term-sentence vectors, as the dataset is a collection of documents, and the cosine-like measures are applied here.
The R implementation
Take a look at the ch_05_ahclustering.R R code file from the bundle of R code for the previously mentioned algorithms. The codes can be tested with the following command:
> source("ch_05_ahclustering.R")
News portals provide visitors with tremendous news categorized with a predefined set of topics. With the exponential growth of information we receive from the Internet, clustering technologies are widely used for web documents categorization, which include online news. These are often news streams or news feeds.
One advantage of a clustering algorithm for this task is that there is no need for prior domain knowledge. News can be summarized by clustering news that covers specific events. Unsupervised clustering can also play a pivotal role in discovering the intrinsic topical structure of the existing text collections, while new categorization is used to classify the documents according to a predefined set of classes.
Services such as Google News are provided. For a story published by a couple of new agencies or even the same agency, there are often various versions that exist at the same time or span the same range of days. Here, clustering can help aggregate the news related to the same story, and the result is a better overview of the current story for visitors.
As preprocessing steps, plain texts are extracted from the web pages or news pages. Reuters-22173 and -21578 are two popular documents dataset used for research. The representation of a data instance in the dataset can either be classical term-document vectors or term-sentence vectors, as the dataset is a collection of documents, and the cosine-like measures are applied here.
News categorization
News portals provide visitors with tremendous news categorized with a predefined set of topics. With the exponential growth of information we receive from the Internet, clustering technologies are widely used for web documents categorization, which include online news. These are often news streams or news feeds.
One advantage of a clustering algorithm for this task is that there is no need for prior domain knowledge. News can be summarized by clustering news that covers specific events. Unsupervised clustering can also play a pivotal role in discovering the intrinsic topical structure of the existing text collections, while new categorization is used to classify the documents according to a predefined set of classes.
Services such as Google News are provided. For a story published by a couple of new agencies or even the same agency, there are often various versions that exist at the same time or span the same range of days. Here, clustering can help aggregate the news related to the same story, and the result is a better overview of the current story for visitors.
As preprocessing steps, plain texts are extracted from the web pages or news pages. Reuters-22173 and -21578 are two popular documents dataset used for research. The representation of a data instance in the dataset can either be classical term-document vectors or term-sentence vectors, as the dataset is a collection of documents, and the cosine-like measures are applied here.
Here are some practice questions for you to check whether you understood the concepts we covered in this chapter:
- What is the PAM clustering algorithm?
- What is the k-means algorithm?
- What is the k-medoids algorithm?
- What is the CLARA algorithm?
- What is the CLARANS algorithm?
In this chapter, we looked at:
- Partition-based clustering.
- The k-means algorithm is a partition-based clustering algorithm. The centroids of clusters are defined as a representative of each cluster. In k-means clustering, a set of n data points in a D-dimensional space and an integer k are given. The problem is to distribute a set of k points in the centers to minimize the SSE.
- The k-medoids algorithm is a partition-based clustering algorithm. The representatives of each resulting clusters are chosen from the dataset itself, that is, the data objects belong to it.
- CLARA depends on sampling. It draws a sample from the original dataset instead of the entire dataset. PAM is then applied to each sampling. Then, the best result is kept during all the iterations.
- CLARANS is a clustering algorithm based on randomized search.
- The affinity propagation clustering algorithm recursively passes affinity messages between objects or points and converges to exemplars adaptively.
- Spectral clustering is used to construct graph partitions based on eigenvectors of the adjacency matrix.
- Hierarchical clustering decomposes a dataset D into levels of nested clusters; this is represented by a dendrogram, a tree that iteratively splits the dataset D into smaller subsets. The process stops only after each subset consists of only one object.
The next chapter will cover more advanced topics related to clustering algorithms, density-based algorithms, grid-based algorithms, the EM algorithm, high-dimensional algorithms, constraint-based clustering algorithms, and so on.