Book Image

The Business Analyst's Guide to Oracle Hyperion Interactive Reporting 11

By : Edward Cody
Book Image

The Business Analyst's Guide to Oracle Hyperion Interactive Reporting 11

By: Edward Cody

Overview of this book

Oracle Hyperion Interactive Reporting is one of the many products in the Oracle Enterprise Performance Management software suite, an industry-leading business intelligence software package. The primary focus of the Interactive Reporting product is to provide strong relational querying and data analysis capabilities. It also provides the capability to disseminate information throughout an enterprise. There is a very steep learning curve for most users of this tool.This book examines the power of the Interactive Reporting Web Client software, focusing on the key features of each section of the product. The author's experience in developing and supporting Interactive Reporting users is very well documented in this book. The goal is to educate you on every useful feature of the product, enabling you to gather information from various sources and process it to produce meaningful results that help you to spot problems and analyze trends necessary for business decisions.The book starts with a quick introduction to the product interface and the EPM Workspace, with explanation of importing and provisioning. It then takes you through each section from building a query and data model to building graphical displays of the data in a logical sequence. The report sections and interactive dashboards are also discussed at length. The book also covers advanced features of the product and provides you with the information necessary to build the foundation for creating complex queries and computations using the product.
Table of Contents (16 chapters)
The Business Analyst's Guide to Oracle Hyperion Interactive Reporting 11
Credits
About the Author
Acknowledgement
About the Reviewer
Preface
Index

The Query section layout


The Query section layout is configured to easily drag-and-drop the content from a data model into the Request, Filter, and Sort lines to build the desired query. This section contains a main window that is used to configure and display the data model. The Sections window, Section Title Bar, and Status Bar facilitate working with the query and provide useful information throughout the process.

Sections window

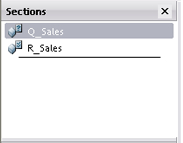
The Sections window is located on top of the Section Catalogue and is displayed in the following screenshot. Each Query section in the document is always accompanied by a Results section. The Query section is used to model a query, and the Results section contains the data returned after the query is processed. In the following screenshot, the Query section is named Q_Sales and the Results section is named R_Sales:

Note

Each section in the document must contain a unique name. To edit the name of a section, right-click on the section in the Section Catalogue, and...